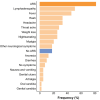
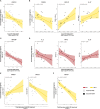
Longitudinal patterns of inflammatory mediators after acute HIV infection correlate to intact and total reservoir
- PMID: 38250083
- PMCID: PMC10796502
- DOI: 10.3389/fimmu.2023.1337316
Longitudinal patterns of inflammatory mediators after acute HIV infection correlate to intact and total reservoir
Abstract
Background: Despite the beneficial effects of antiretroviral therapy (ART) initiation during acute HIV infection (AHI), residual immune activation remains a hallmark of treated HIV infection.
Methods: Plasma concentrations of 40 mediators were measured longitudinally in 39 early treated participants of a Belgian AHI cohort (HIV+) and in 21 HIV-negative controls (HIV-). We investigated the association of the inflammatory profile with clinical presentation, plasma viral load, immunological parameters, and in-depth characterization of the HIV reservoir.
Results: While levels of most soluble mediators normalized with suppressive ART, we demonstrated the persistence of a pro-inflammatory signature in early treated HIV+ participants in comparison to HIV- controls. Examination of these mediators demonstrated a correlation with their levels during AHI, which seemed to be viremia-driven, and suggested involvement of an activated myeloid compartment, IFN-γ-signaling, and inflammasome-related pathways. Interestingly, some of these pro-inflammatory mediators correlated with a larger reservoir size and slower reservoir decay. In contrast, we also identified soluble mediators which were associated with favorable effects on immunovirological outcomes and reservoir, both during and after AHI.
Conclusion: These data highlight how the persistent pro-inflammatory profile observed in early ART treated individuals is shaped during AHI and is intertwined with viral dynamics.
Keywords: HIV reservoir; acute HIV infection; chemokines; cytokines; early ART; inflammation; plasma soluble mediators.
Copyright © 2024 De Clercq, De Scheerder, Mortier, Verhofstede, Vandecasteele, Allard, Necsoi, De Wit, Gerlo and Vandekerckhove.
Conflict of interest statement
LV has received consulting fees and travel grants from Gilead Sciences and ViiV Healthcare, paid to his institution. JDC and SG have received travel grants from ViiV Healthcare. The remaining authors declare that the research was conducted in the absence of any commercial or financial relationships that could be construed as a potential conflict of interest.
Figures


Similar articles
-
Staging of immuno-virological dynamics during acute HIV infection in a Belgian prospective cohort study.J Virus Erad. 2024 Sep 25;10(3):100392. doi: 10.1016/j.jve.2024.100392. eCollection 2024 Sep. J Virus Erad. 2024. PMID: 39403428 Free PMC article.
-
Association between the cytokine storm, immune cell dynamics, and viral replicative capacity in hyperacute HIV infection.BMC Med. 2020 Mar 25;18(1):81. doi: 10.1186/s12916-020-01529-6. BMC Med. 2020. PMID: 32209092 Free PMC article.
-
Long-term effects of early antiretroviral initiation on HIV reservoir markers: a longitudinal analysis of the MERLIN clinical study.Lancet Microbe. 2021 May;2(5):e198-e209. doi: 10.1016/s2666-5247(21)00010-0. Epub 2021 Mar 23. Lancet Microbe. 2021. PMID: 34841369 Free PMC article.
-
How does the timing of antiretroviral therapy initiation in acute infection affect HIV reservoirs?Curr Opin HIV AIDS. 2015 Jan;10(1):18-28. doi: 10.1097/COH.0000000000000122. Curr Opin HIV AIDS. 2015. PMID: 25415421 Free PMC article. Review.
-
Episomal HIV-1 DNA and its relationship to other markers of HIV-1 persistence.Retrovirology. 2018 Jan 30;15(1):15. doi: 10.1186/s12977-018-0398-1. Retrovirology. 2018. PMID: 29378611 Free PMC article. Review.
Cited by
-
Deciphering the role of endothelial granulocyte macrophage-CSF in chronic inflammation associated with HIV.iScience. 2024 Sep 11;27(10):110909. doi: 10.1016/j.isci.2024.110909. eCollection 2024 Oct 18. iScience. 2024. PMID: 39391731 Free PMC article.
-
Intact HIV DNA decays in children with and without complete viral load suppression.PLoS Pathog. 2025 Apr 4;21(4):e1013003. doi: 10.1371/journal.ppat.1013003. eCollection 2025 Apr. PLoS Pathog. 2025. PMID: 40184428 Free PMC article.
-
From network biology to immunity: potential longitudinal biomarkers for targeting the network topology of the HIV reservoir.J Transl Med. 2025 Aug 13;23(1):906. doi: 10.1186/s12967-025-06919-z. J Transl Med. 2025. PMID: 40804634 Free PMC article. Review.
-
Mapping the intersection of HIV and Alzheimer's disease: a bibliometric analysis of emerging research trends.Front Neurol. 2025 Apr 29;16:1568022. doi: 10.3389/fneur.2025.1568022. eCollection 2025. Front Neurol. 2025. PMID: 40365453 Free PMC article.
-
Rapid Biphasic Decay of Intact and Defective HIV DNA Reservoir During Acute Treated HIV Disease.medRxiv [Preprint]. 2024 Aug 22:2024.03.27.24304867. doi: 10.1101/2024.03.27.24304867. medRxiv. 2024. Update in: Nat Commun. 2024 Nov 18;15(1):9966. doi: 10.1038/s41467-024-54116-1. PMID: 38585951 Free PMC article. Updated. Preprint.
References
-
- Stacey AR, Norris PJ, Qin L, Haygreen EA, Taylor E, Heitman J, et al. . Induction of a striking systemic cytokine cascade prior to peak viremia in acute human immunodeficiency virus type 1 infection, in contrast to more modest and delayed responses in acute hepatitis B and C virus infections. J Virol (2009) 83(8):3719–33. doi: 10.1128/JVI.01844-08 - DOI - PMC - PubMed
-
- Cocchi F, DeVico AL, Garzino-Demo A, Arya SK, Gallo RC, Lusso P. Identification of RANTES, MIP-1alpha, and MIP-1beta as the major HIV-suppressive factors produced by CD8+ T cells (1995). Available at: https://zenodo.org/record/1231052 (Accessed 2023 Aug 30). - PubMed
Publication types
MeSH terms
Substances
LinkOut - more resources
Full Text Sources
Medical

