. 2024 Feb;84(1):62-90.
doi: 10.1177/00131644231164363. Epub 2023 Apr 15.

Artificial Neural Networks for Short-Form Development of Psychometric Tests: A Study on Synthetic Populations Using Autoencoders

Affiliations

Artificial Neural Networks for Short-Form Development of Psychometric Tests: A Study on Synthetic Populations Using Autoencoders

Monica Casella et al. Educ Psychol Meas. 2024 Feb.

Abstract

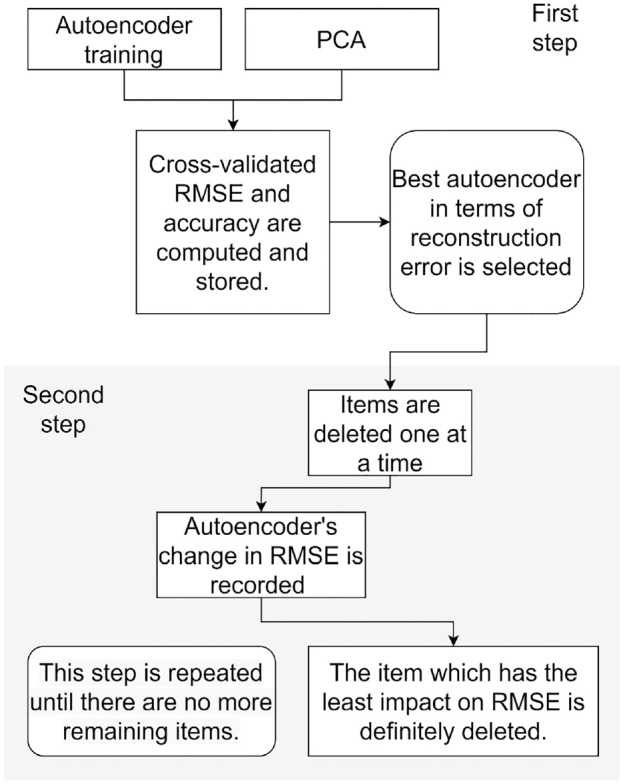
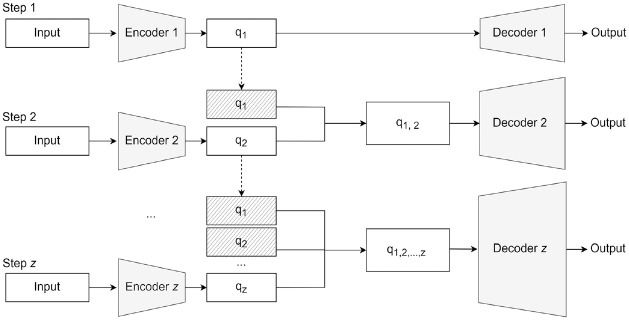
Short-form development is an important topic in psychometric research, which requires researchers to face methodological choices at different steps. The statistical techniques traditionally used for shortening tests, which belong to the so-called exploratory model, make assumptions not always verified in psychological data. This article proposes a machine learning-based autonomous procedure for short-form development that combines explanatory and predictive techniques in an integrative approach. The study investigates the item-selection performance of two autoencoders: a particular type of artificial neural network that is comparable to principal component analysis. The procedure is tested on artificial data simulated from a factor-based population and is compared with existent computational approaches to develop short forms. Autoencoders require mild assumptions on data characteristics and provide a method to predict long-form items' responses from the short form. Indeed, results show that they can help the researcher to develop a short form by automatically selecting a subset of items that better reconstruct the original item's responses and that preserve the internal structure of the long-form.

Keywords: autoencoders; machine learning; principal component analysis; short form.


Conflict of interest statement

The authors declared no potential conflicts of interest with respect to the research, authorship, and/or publication of this article.

Figures

Figure 1
Figure 1
Autoencoder’s Typical Architecture
Figure 2
Figure 2
Item Selection Procedure Note. PCA = principal component analysis; RMSE = root mean squared error.
Figure 3
Figure 3
Path Model for Data Generation
Figure 4
Figure 4
PCA-AE Training Procedure Note. PCA-AE = principal component analysis-autoencoder.
Figure 5
Figure 5
One-Hot Encoding Transformation of Original Item Responses
Figure 6
Figure 6
PCA and PCA-AE Average RMSE (A) and Accuracy (B) for Each Simulated Sample Size Note. PCA = principal component analysis; PCA-AE = principal component analysis-autoencoder; RMSE = root mean squared error.
Figure 7
Figure 7
PCA-AE’s Item Selection Procedure Results for Each Simulated Sample Size Note. PCA-AE = principal component analysis-autoencoder.
Figure 8
Figure 8
PCA-AE’s Item Selection Procedure Results on a Control Model Note. The figure shows results for all replications and sample sizes. The control model has all factor loadings equal to 0.8 Note. PCA-AE = principal component analysis-autoencoder.
Figure 9
Figure 9
PCA-AE RMSE (A) and Accuracy (B) for Each Step of the Item Selection Procedure Note. PCA-AE = principal component analysis-autoencoder.
Figure 10
Figure 10
NL-AE and PCA-AE Average RMSE (A) and Accuracy (B) for Each Simulated Sample Size Note. NL-AE = non-linear autoencoder; PCA-AE = principal component analysis-autoencoder; RMSE = root mean squared error.
Figure 11
Figure 11
NL-AE’s Item Selection Procedure Results for Each Simulated Sample Size Note. NL-AE = non-linear autoencoder.
Figure 12
Figure 12
NL-AE’s Item Selection Procedure Results on a Control Model Note. The figure shows the results for all replications and sample sizes. The control model has all factor loadings equal to 0.8. NL-AE = non-linear autoencoder.
Figure 13
Figure 13
NL-AE RMSE (A) and Accuracy (B) for Each Step of the Item Selection Procedure Note. NL-AE = non-linear autoencoder; RMSE = root mean squared error.
Figure 14
Figure 14
Frequency of Choice of Each Item for the Compared Shortening Methods Note. The figure shows, for each one of the three simulated components and considering 100 replications, how many times a single item is chosen by the four different shortening methods. The sample size is 500. ACO = ant colony optimization; GA = genetic algorithm; NL-AE = non-linear autoencoder; PCA-AE = principal component analysis-autoencoder.

References

    1. Alkhayrat M., Aljnidi M., Aljoumaa K. (2020). A comparative dimensionality reduction study in telecom customer segmentation using deep learning and PCA. Journal of Big Data, 7(1), 1–23.
    1. Bajcar B., Babiak J. (2022). Transformational and transactional leadership in the polish organizational context: Validation of the full and short forms of the Multifactor Leadership Questionnaire. Frontiers in Psychology, 13, Article 908594. - PMC - PubMed
    1. Baldi P., Hornik K. (1989). Neural networks and principal component analysis: Learning from examples without local minima. Neural Networks, 2(1), 53–58.
    1. Bauer D. J. (2005). The role of nonlinear factor-to-indicator relationships in tests of measurement equivalence. Psychological Methods, 10(3), 305–316. - PubMed
    1. Belzak W. C., Bauer D. J. (2019). Interaction effects may actually be nonlinear effects in disguise: A review of the problem and potential solutions. Addictive Behaviors, 94, 99–108. - PubMed

LinkOut - more resources