. 2024 Jan 10;3(1):pgae010.
doi: 10.1093/pnasnexus/pgae010. eCollection 2024 Jan.

Sensory input to cortex encoded on low-dimensional periphery-correlated subspaces

Affiliations

Sensory input to cortex encoded on low-dimensional periphery-correlated subspaces

Andrea K Barreiro et al. PNAS Nexus. .

Abstract

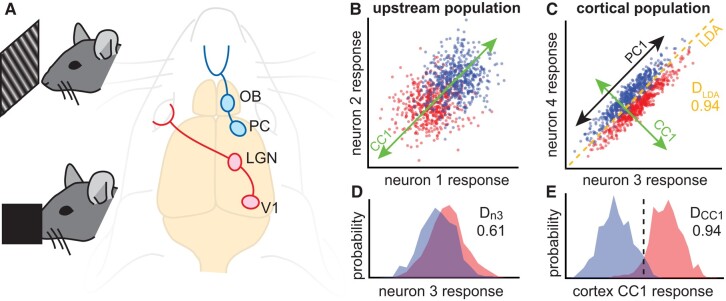
As information about the world is conveyed from the sensory periphery to central neural circuits, it mixes with complex ongoing cortical activity. How do neural populations keep track of sensory signals, separating them from noisy ongoing activity? Here, we show that sensory signals are encoded more reliably in certain low-dimensional subspaces. These coding subspaces are defined by correlations between neural activity in the primary sensory cortex and upstream sensory brain regions; the most correlated dimensions were best for decoding. We analytically show that these correlation-based coding subspaces improve, reaching optimal limits (without an ideal observer), as noise correlations between cortex and upstream regions are reduced. We show that this principle generalizes across diverse sensory stimuli in the olfactory system and the visual system of awake mice. Our results demonstrate an algorithm the cortex may use to multiplex different functions, processing sensory input in low-dimensional subspaces separate from other ongoing functions.


Figures

Fig. 1.
Fig. 1.
Using inter-regional correlations to find coding subspace. A) We hypothesize that correlations between primary sensory cortices (PC or V1) and upstream populations (OB or LGN) can be used (via CCA) to identify coding subspaces with reduced noise. We test this hypothesis in awake mice using simultaneous recordings from V1 and LGN during visual stimulation (top) or PC and OB during olfactory stimulation (bottom). B) Each point represents the simulated response of neurons 1 and 2 to one of two hypothetical stimuli (red and blue). C) Simulated responses of neurons 3 and 4 in the cortical population. The optimal LDA decoder achieves 94% accuracy. CCA applied to the two populations identifies a linear subspace (CC1, green) for each population. Projection of each population's response onto its CC1 results in maximized correlation across populations. PCA finds the linear subspace (PC1, black) with maximal variability; in this case, the variability is due to noise. D) Response distributions for the two stimulus types overlap substantially for neuron 3, resulting in suboptimal decoding accuracy (61%). E) When projected onto CC1, the response distributions better separate the two stimulus types, achieving optimal decoding accuracy (94%, same as LDA). The dashed line indicates the optimal threshold used for calculating the decoding accuracy.
Fig. 2.
Fig. 2.
Cross-population noise correlations and CC1 correlation determine the accuracy of coding subspace. A) Example parameters for population x (neurons 1x and 2x) and population y (neurons 1y and 2y) for two stimulus types (A and B). When stimulus-independent cross-population covariance between populations x and y is zero (green), the first component CC1 is the same as the optimal decoding dimension. Nonzero cross-population covariance results in deviations from the optimal decoding dimension. B) Each point represents one of 50,000 randomly chosen parameter sets for the 2 × 2 population. DCC1 is perfect (same as optimal D, Δ = 0) if the cross-population noise correlations are zero (black points). If cross-population noise correlations are nonzero, then CC1 decoding is often suboptimal (blue points, Δ > 0). The highlighted set of blue points is studied further in panels C and D. C) Decoding error (Δ) is the normalized distance from optimal D (see red diagram in panel B). DCC1 is near-optimal (low Δ) for Cxy below about 0.4. The points shown in panel C exclude cases with RCC1 < 0.75 (Materials and methods). D) Achieving low decoding error Δ also requires sufficiently large RCC1. Shown results exclude cases with Cxy > 0.1 (Materials and methods). Blue lines in panels C and D—moving average of points.
Fig. 3.
Fig. 3.
Dual-region neural populations achieve optimal CCA decoding of visual and olfactory stimuli. A) Spike count responses from two example neurons in LGN (left) and two in V1 (right), recorded from an awake mouse viewing two static gratings (90° and 30° orientations, 42 trials of each). Projection onto CC1 results in excellent (optimal) decoding in this example. B) Same as panel A, except with a different pair of LGN neurons. For this LGN population, the CC1 subspace in the cortex becomes suboptimal for decoding. C) Summary of CC1 decoding accuracy vs. optimal decoding for 10,000 randomly chosen 2 × 2 populations. Purple and cyan points indicate the examples shown in A and B, respectively. D) The fraction of all 10,000 populations with DCC1 above 0.7 is greatest when the angle difference between the two gratings is greatest. Each line represents a different mouse. E) Comparing all 10,000 populations, the maximum DCC1 was above 85% for 7 of 9 mice and typically for gratings with large angle differences. F–H) Same as panels A–C, but for a different awake mouse breathing two odorants (1-hexanol and ethyl tiglate, 15 trials of each). Note that the discrete values of D in panels C and H are determined by the number of stimulus trials; many points overlap at the same D value.
Fig. 4.
Fig. 4.
Explaining deviations from optimal CC1 decoding of visual and olfactory stimuli. A) CC1 decoding should perform poorly if the largest correlations between V1 and LGN, for example, are due to “noise,” i.e. not related to the sensory signal we want to decode. In this “bad CC1 decoding” case (left), CCA will identify a CC1 direction that is due to the noise correlation and RCC1 will reveal the strength of that noise correlation. When Cxy is small enough, RCC1 will reflect the strength of signal, and CC1 will decode well (right). B) As predicted, the difference (error Δ) between optimal decoding and DCC1 was often strongly correlated with cross-population noise correlation Cxy. Each line represents an average of over 200 different pairs of LGN neurons and one pair of V1 neurons (excluding those with small RCC1, see Materials and methods). C) Each distribution summarizes the correlations between error Δ and Cxy for 200 populations in one mouse and one pair of stimuli (the color code for specific mouse/stimulus is shown in Fig. S1). Notice that most of these correlations are positive, like the examples in panel A. D) As predicted, error Δ is negatively correlated with RCC1. Each point represents one 2 × 2 population (excluding cases with large Cxy, see Materials and methods). E) Each distribution summarizes the anticorrelations between error Δ and RCC1 for one mouse and stimulus pair (same cases as panel B). F–I) Same as panels A–D, but for OB + PC populations in different mice with olfactory stimulation. J) For 3 × 3 populations with high optimal decoding (Materials and methods), we show how RCCn decreases for canonical components beyond the first. K) Only CC1 has a significant relationship between Cxy and decoding error Δ. L) Only CC1 has a significant relationship between RCC1 and Δ.
Fig. 5.
Fig. 5.
Biophysical implementation of CC1 decoding. Synaptically weighted summation of inputs naturally performs projections of high-dimensional input onto 1D subspace. The spike threshold ϴ naturally imposes a “decision boundary” for classifying stimulus type of input. Synaptic plasticity mechanisms can tune the synaptic weights so that the projections are aligned with CC1 (38).

References

    1. Matyas F, et al. . 2010. Motor control by sensory cortex. Science. 330:1240–1243. - PubMed
    1. Zagha E, Casale AE, Sachdev RNS, McGinley MJ, McCormick DA. 2013. Motor cortex feedback influences sensory processing by modulating network state. Neuron. 79:567–578. - PMC - PubMed
    1. Ghazanfar AA, Schroeder CE. 2006. Is neocortex essentially multisensory? Trends Cogn Sci. 10:278–285. - PubMed
    1. Parker PRL, Brown MA, Smear MC, Niell CM. 2020. Movement-related signals in sensory areas: roles in natural behavior. Trends Neurosci. 43:581–595. - PMC - PubMed
    1. Ayaz A, Saleem AB, Schölvinck ML, Carandini M. 2013. Locomotion controls spatial integration in mouse visual cortex. Curr Biol. 23:890–894. - PMC - PubMed