. 2024 Jan 5:14:1297367.
doi: 10.3389/fgene.2023.1297367. eCollection 2023.

Phylogenetic conservation of Trop-2 across species-rodent and primate genomics model anti-Trop-2 therapy for pre-clinical benchmarks

Affiliations

Phylogenetic conservation of Trop-2 across species-rodent and primate genomics model anti-Trop-2 therapy for pre-clinical benchmarks

Emanuela Guerra et al. Front Genet. .

Abstract

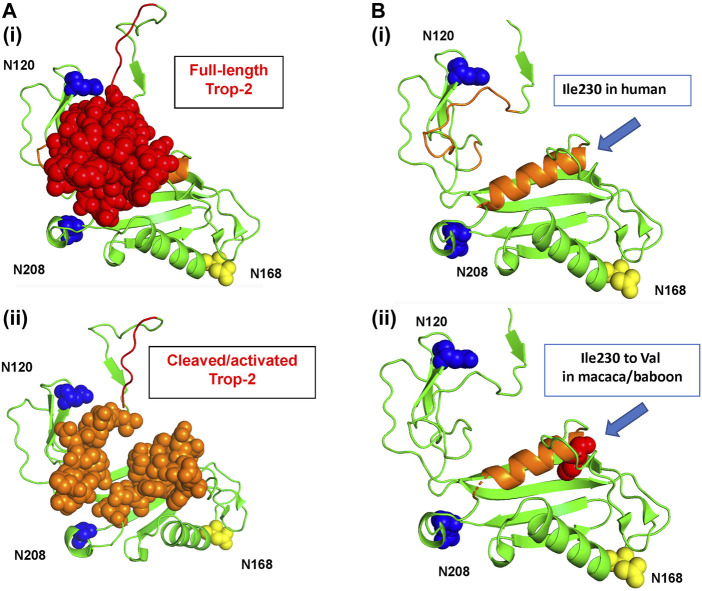
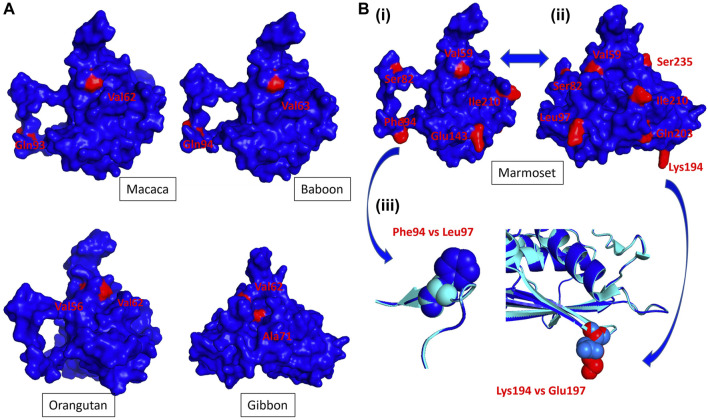
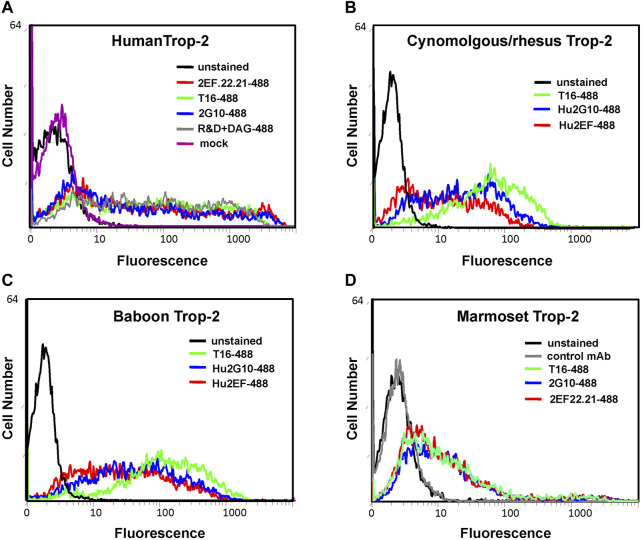
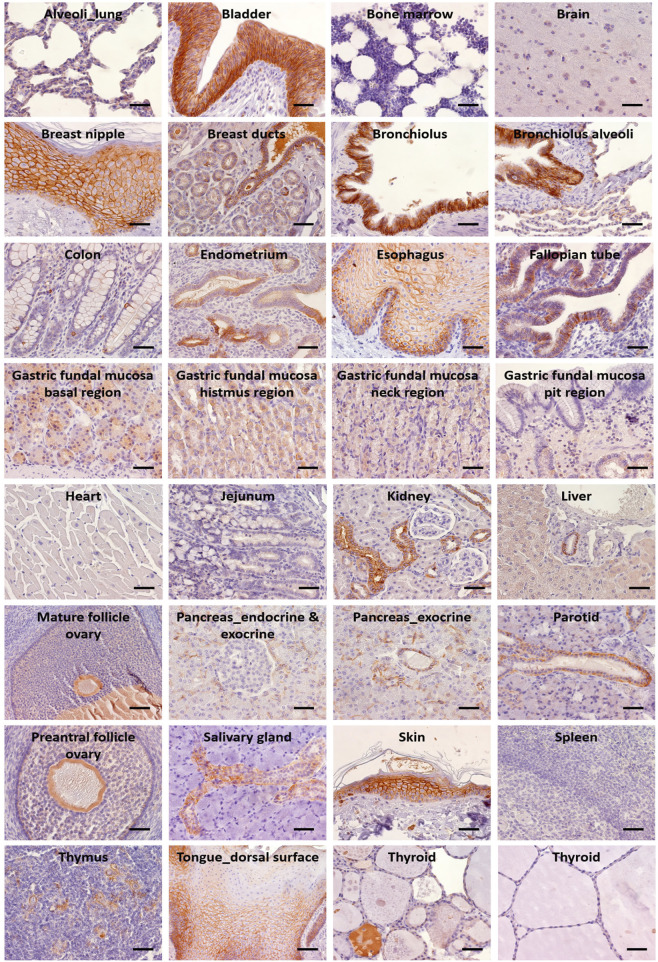
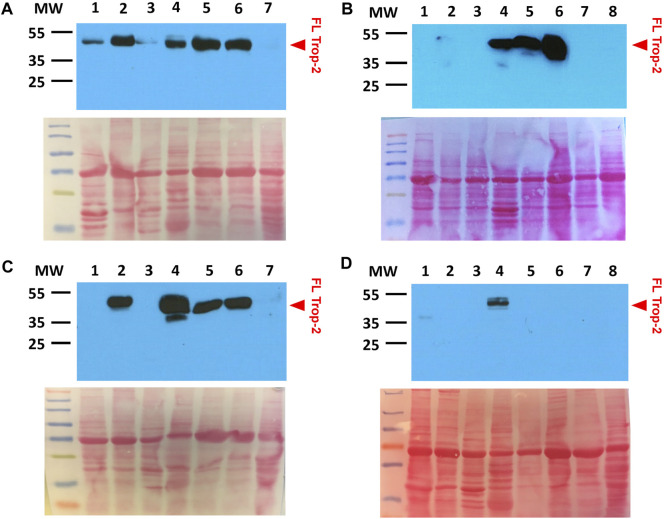
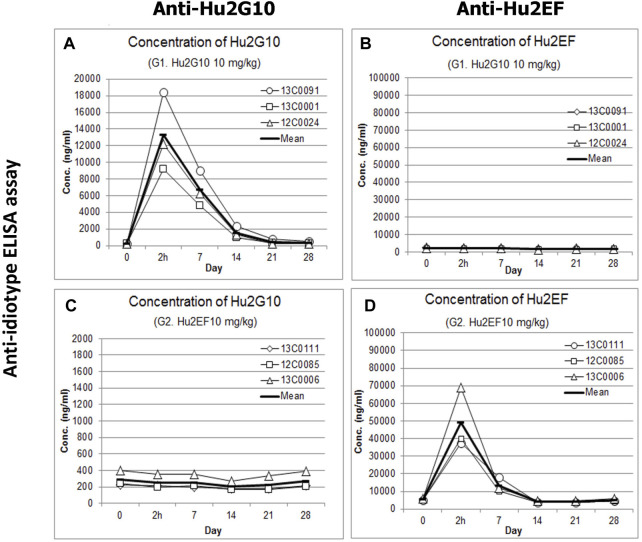
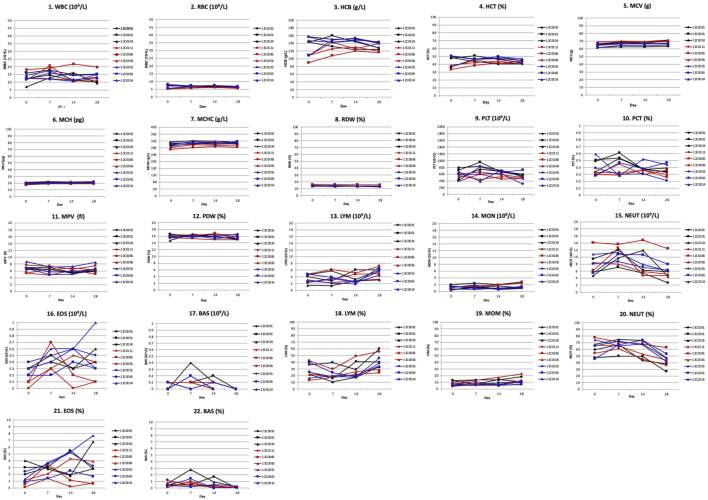
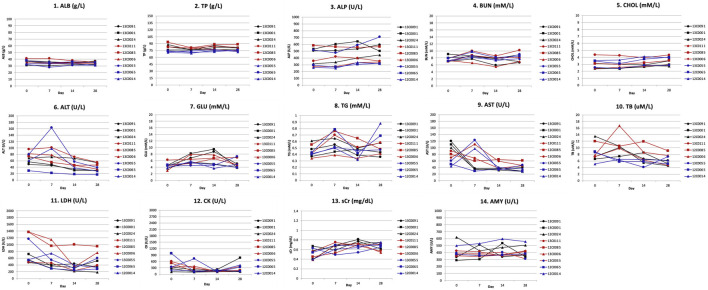
A phylogenetic conservation analysis of Trop-2 across vertebrate species showed a high degree of sequence conservation, permitting to explore multiple models as pre-clinical benchmarks. Sequence divergence and incomplete conservation of expression patterns were observed in mouse and rat. Primate Trop-2 sequences were found to be 95%-100% identical to the human sequence. Comparative three-dimension primate Trop-2 structures were obtained with AlphaFold and homology modeling. This revealed high structure conservation of Trop-2 (0.66 ProMod3 GMQE, 0.80-0.86 ± 0.05 QMEANDisCo scores), with conservative amino acid changes at variant sites. Primate TACSTD2/TROP2 cDNAs were cloned and transfectants for individual ORF were shown to be efficiently recognized by humanized anti-Trop-2 monoclonal antibodies (Hu2G10, Hu2EF). Immunohistochemistry analysis of Macaca mulatta (rhesus monkey) tissues showed Trop-2 expression patterns that closely followed those in human tissues. This led us to test Trop-2 targeting in vivo in Macaca fascicularis (cynomolgus monkey). Intravenously injected Hu2G10 and Hu2EF were well tolerated from 5 to 10 mg/kg. Neither neurological, respiratory, digestive, urinary symptoms, nor biochemical or hematological toxicities were detected during 28-day observation. Blood serum pharmacokinetic (PK) studies were conducted utilizing anti-idiotypic antibodies in capture-ELISA assays. Hu2G10 (t1/2 = 6.5 days) and Hu2EF (t1/2 = 5.5 days) were stable in plasma, and were detectable in the circulation up to 3 weeks after the infusion. These findings validate primates as reliable models for Hu2G10 and Hu2EF toxicity and PK, and support the use of these antibodies as next-generation anti-Trop-2 immunotherapy tools.

Keywords: Trop-2; pharmacokinetics; phylogenetic conservation; primate genomics; toxicity.


Conflict of interest statement

EG is an inventor in patents WO201687651 and WO201784763, and a partner in Mediterranea Theranostic Srl. MT is an inventor in patent WO201784763. SA is an inventor in patents WO201089782, WO201687651 and WO201784763, and is founder and CEO of Oncoxx Biotech Srl and Mediterranea Theranostic Srl. The remaining authors declare that the research was conducted in the absence of any commercial or financial relationships that could be construed as a potential conflict of interest. The authors declared that they were an editorial board member of Frontiers, at the time of submission. This had no impact on the peer review process and the final decision.

Figures

FIGURE 1
FIGURE 1
The human Trop-2 protein structure. The 3D structure of the extra-cellular domain of Trop-2 (Pavšič, 2021) is in ribbon diagrams and sphere/protein surface models. Trop-2 N-glycosylation sites are indicated. N120 and N-208 are in blue; the N120A and N-208A mutants were shown to abolish binding of Claudin-7 to Trop-2 (Mori et al., 2019; Kamble et al., 2021). The N168 glycosylation site is in yellow. (A) Top view. (i) The N-terminal subunit of Trop-2 is in red as sphere model; (ii) the 3D structure of the extra-cellular domain of Trop-2 devoid of the N-terminal subunit is shown. The groove between the glycans at N120 and N208 that becomes more accessible upon ADAM10-cleavage and rearrangement of the N-terminal ADAM10-cleaved subunit (Guerra et al., 2023a) is in orange, sphere model. (B) Ribbon diagrams of the activation site of Trop-2 (Mori et al., 2019; Kamble et al., 2021), and binding site of Hu2G10 (Guerra et al., 2023a) are provided for clarity. Blue arrow: polymorphic residue across NHP species. (i) Human Ile230 residue. (ii) Space-fill model of cynomolgus and baboon Val230 is provided. The residue is buried at the bottom of the orange α-helix, below the solvent-exposed region.
FIGURE 2
FIGURE 2
The NHP Trop-2 protein structure. NHP 3D structures were modeled versus the crystal structure of the human Trop-2 (Pavšič, 2021), following the described procedures (Materials and Methods). The 3D modeling parameters are listed in Supplementary Table S1. Polymorphic residues versus the human Trop-2 sequence are in red. (A) Side (macaca, baboon, orangutan) and frontal (gibbon) views of primate Trop-2s (Supplementary Table S1). The 3D model surface representation was obtained with PyMol (Supplementary Table S1). (B) (i) Side and (ii) frontal views of the marmoset Trop-2 3D structure. (iii) Overlap of the human and marmoset Trop-2 is in ribbon/contour diagrams. Alpha helices, beta sheets (flat arrows) and loops are shown. The ribbon diagram of marmoset Trop-2 is in blue; that of the human Trop-2 is in cyan. (blue arrows) Phe94 in marmoset versus Leu97 in human and Lys194 in marmoset versus Glu197 in human are magnified.
FIGURE 3
FIGURE 3
Flow cytometry analysis of NHP cDNA transfectants with the indicated anti-Trop-2 mAbs. Transient transfectants of marmoset TROP2 cDNA were generated in HEK-293 cells. Human, baboon and rhesus/cynomolgus monkey TROP2 cDNA were stably transfected in COS-7 cells, following G418-selection and flow-cytometry sorting of expressing population. (A) Cells transfected with the human Trop-2 cDNA. (B) Cells transfected with the rhesus/cynomolgus monkey Trop-2 cDNA (C) Cells transfected with the baboon Trop-2 cDNA. (D) HEK-293 cells transiently transfected with the marmoset Trop-2 cDNA. Efficient binding of 2EF/Hu2EF-Alexa488 (red profiles) and 2G10/Hu2G10-Alexa488 (blue profiles) was found to all NHP Trop-2 transfectants. The Alexa488-tagged AbT16 anti-Trop-2 mAb (green profiles) was used as benchmark. (D) An irrelevant mAb was used as negative control (gray profile); (A) staining using the AF650 anti-Trop-2 goat pAb was used as a positive control (gray profile). Mock transfected cells are in magenta. Unstained cells are in black. Autofluorescence compensation was used in all analyses (Alberti et al., 1987).
FIGURE 4
FIGURE 4
IHC analysis of Trop-2 protein expression in rhesus monkey tissues. Staining was performed with the AF650 anti-Trop-2 goat pAb. Individual organs are indicated. Brown staining reveals Trop-2 expression. Trop-2 expression was quantified as percentage of stained cells and as intensity of the staining. An IHC positivity score was determined according to five categories: 0 (0% of positive cells), 1 (<10% of positive cells), 2 (10%–50% of positive cells), 3 (50%–80% of positive cells), 4 (>80% of positive cells). An intensity score classified the average intensity of the positive cells as 1 (weak staining), 2 (moderate staining) or 3 (strong staining) (Supplementary Table S2). Bars: 50 µm.
FIGURE 5
FIGURE 5
Lack of Trop-2 cleavage in rhesus monkey normal tissues. (A) 1: tongue; 2: urinary bladder; 3: heart; 4: salivary gland; 5: mammary gland; 6: skin; 7: kidney. (B) 1: brain; 2: eye; 3: thyroid; 4: parotid gland; 5: esophagus; 6: lung; 7: liver; 8: pancreas. (C) 1: uterus; 2: urinary bladder; 3: heart; 4: salivary gland; 5: mammary gland; 6: skin; 7: kidney. (D) 1: stomach; 2: spleen; 3: thymus; 4: tongue; 5: duodenum; 6: colon; 7: jejunum; 8: ovary. Western blotting was performed with the AF650 anti-Trop-2 goat pAb. Ponceau-red stained SDS-PAGE gels are shown below each Western blot for assessing equal lane loading. MW: molecular weight markers. Prestained mw markers were utilized for clarity. Red arrowhead, FL: full length Trop-2.
FIGURE 6
FIGURE 6
Pharmacokinetics of Hu2G10 and Hu2EF in cynomolgus monkey. Three individual cynomolgus monkeys for each experimental group received an intravenous infusion of 10 mg/Kg of Hu2G10 or 10 mg/Kg of Hu2EF or 5 mg/Kg of Hu2G10 plus 5 mg/Kg of Hu2EF at day 0. Blood serum concentrations of Hu2G10 and Hu2EF were measured by ELISA capture assays with anti-idiotypic antibodies (Supplementary Materials and Methods) at the indicated time points, over 28 days after mAb injection. Absolute parameter values are reported in Supplementary Table S3. The curves displaying average determinations (mean values of replica wells) are in bold. Standard curves of Hu2G10 and Hu2EF progressive dilutions, as included in individual ELISA assay plates, were used as reference (Supplementary Table S3). (A, B) Blood serum concentrations of Hu2G10 and Hu2EF, respectively, in the experimental group receiving 10 mg/kg of Hu2G10. (C, D) Blood serum concentrations of Hu2G10 and Hu2EF, respectively, in the experimental group receiving 10 mg/kg of Hu2EF.
FIGURE 7
FIGURE 7
Hematological toxicity of Hu2G10 and Hu2EF in cynomolgus monkey. Hematological determinations were performed on day 0, 7, 14 and 28 after mAb infusion. Hematological parameters included white blood cells (WBC), red blood cells (RBC), hemoglobin (HGB), hematocrit (HCT), mean corpuscular volume (MCV), mean corpuscular hemoglobin (MCH), mean corpuscular hemoglobin concentration (MCHC), red cell distribution width (RDW), platelets (PLT), plateletocrit (PCT), mean platelet volume (MPV), platelet distribution width (PDW), white blood cell differential counts of lymphocytes (LYM), monocytes (MON), neutrophils (NEUT), eosinophils (EOS), and basophils (BAS). The black curves correspond to the monkeys receiving 10 mg/Kg of Hu2G10, the red curves correspond to the monkeys receiving 10 mg/Kg of Hu2EF, the blue curves correspond to the monkeys receiving 5 mg/Kg of Hu2G10 plus 5 mg/Kg of Hu2EF. Absolute parameter values are reported in Supplementary Table S3. Differential counts for monocytes, neutrophils and basophils showed essentially no change during the 28-day observation period, except for a minor increase in percent counts of lymphocytes and eosinophils in some monkeys. No significant differences in WBC counts were recorded before and after infusion in any monkey group.
FIGURE 8
FIGURE 8
Blood biochemistry toxicity parameters after Hu2G10 and Hu2EF administration to cynomolgus monkey. Biochemical determinations were made in blood serum samples on day 0, 7, 14 and 28 after mAb infusion. Serum biochemical parameters included albumin (ALB), total proteins (TP), alkaline phosphatase (ALP), blood urea nitrogen (BUN), cholesterol (CHOL), alanine aminotransferase (ALT), glucose (GLU), triglyceride (TG), aspartate aminotransferase (AST), total bilirubin (TB), lactate dehydrogenase (LDH), creatinine kinase (CK), serum creatinine (sCr), and amylase (AMY). The black curves correspond to the monkeys receiving 10 mg/Kg of Hu2G10, the red curves correspond to the monkeys receiving 10 mg/Kg of Hu2EF, the blue curves correspond to the monkeys receiving 5 mg/Kg of Hu2G10 plus 5 mg/Kg of Hu2EF. Absolute parameter values are reported in Supplementary Table S3. No significant differences in biochemical parameter values were recorded before and after infusion in any monkey group.

Similar articles

Cited by

References

    1. Alberti S., Bucci C., Fornaro M., Robotti A., Stella M. (1991). Immunofluorescence analysis in flow cytometry: better selection of antibody-labeled cells after fluorescence overcompensation in the red channel. J. Histochem Cytochem 39 (5), 701–706. 10.1177/39.5.1901878 - DOI - PubMed
    1. Alberti S., Herzenberg L. A. (1988). DNA methylation prevents transfection of genes for specific surface antigens. Proc. Natl. Acad. Sci. U. S. A. 85, 8391–8394. 10.1073/pnas.85.22.8391 - DOI - PMC - PubMed
    1. Alberti S., Nutini M., Herzenberg L. A. (1994). DNA methylation prevents the amplification of TROP1, a tumor associated cell surface antigen gene. Proc. Natl. Acad. Sci. U. S. A. 91, 5833–5837. 10.1073/pnas.91.13.5833 - DOI - PMC - PubMed
    1. Alberti S., Parks D. R., Herzenberg L. A. (1987). A single laser method for subtraction of cell autofluorescence in flow cytometry. Cytometry 8, 114–119. 10.1002/cyto.990080203 - DOI - PubMed
    1. Ambrogi F., Fornili M., Boracchi P., Trerotola M., Relli V., Simeone P., et al. (2014). Trop-2 is a determinant of breast cancer survival. PLoS One 9 (5), e96993. 10.1371/journal.pone.0096993 - DOI - PMC - PubMed