. 2024 Jan 22;8(2):e0364.
doi: 10.1097/HC9.0000000000000364. eCollection 2024 Feb 1.

Single-cell landscape identifies the immunophenotypes and microenvironments of HBV-positive and HBV-negative liver cancer

Affiliations

Single-cell landscape identifies the immunophenotypes and microenvironments of HBV-positive and HBV-negative liver cancer

Qian Zheng et al. Hepatol Commun. .

Abstract

Background: HBV infection leads to HCC and affects immunotherapy. We are exploring the tumor ecosystem in HCC to help gain a deeper understanding and design more effective immunotherapy strategies for patients with HCC with or without HBV infection.

Methods: Single-cell RNA sequencing series were integrated as a discovery cohort to interrogate the tumor microenvironment of HBV-positive (HBV+) HCC and HBV-negative (HBV-) HCC. We further dissect the intratumoral immune status of HBV+ HCC and HBV- HCC. An independent cohort, including samples treated with immune checkpoint blockade therapy, was used to validate the major finding and investigate the effect of HBV infection on response to immunotherapy.

Results: The interrogation of tumor microenvironment indicated that regulatory T cells, exhausted CD8+ T cells, and M1-like Macrophage_MMP9 were enriched in HBV+ HCC, while mucosa-associated invariant T cells were enriched in HBV- HCC. All subclusters of T cells showed high expression of immune checkpoint genes in HBV+ HCC. Regulatory T cells enriched in HBV+ HCC also showed more robust immunosuppressive properties, which was confirmed by cross talk between immune cell subsets. The ability of antigen presentation with major histocompatibility complex-II was downregulated in HBV+ HCC and this phenomenon can be reversed by immunotherapy. Two types of HCC also present different responses to immunotherapy.

Conclusions: There is a more immunosuppressive and exhausted tumor microenvironment in HBV+ HCC than in HBV- HCC. This in-depth immunophenotyping strategy is critical to understanding the impact of HBV and the HCC immune microenvironment and helping develop more effective treatments in patients with HCC.


Conflict of interest statement

The authors have no conflicts to report.

Figures

FIGURE 1
FIGURE 1
Single-cell RNA sequencing profiling of the HBV+ HCC and HBV− HCC tumor environments. (A) t-SNE plot showing the annotation and color codes for cells from different data series. (B) T-SNE plot showing the annotation and color codes for cell subclusters in the HCC tumor environment (TME). (C) T-SNE plot showing the expression of CD45 (PTPRC) for cells in HCC TME. Immune subclusters show high expression. (D) Heat map showing the canonically expressed genes of the six clusters. Data were from CSE0000008. (E) T-SNE plot showing the annotation and color codes for cells from different patients. The distribution of malignant cells revealed differences between patients. (F) T-SNE plot showing the annotation and color codes for cells from HBV+ HCC and HBV− HCC TME. (G) T-SNE plot showing the annotation and color codes for cell subclusters in HCC TME in the validation cohort. (H) Bar graph showing the proportion of immune cell populations among 14 patients from GSE140228 and CSE0000008. (I) Bar graph showing the proportion of immune cell populations among 10 patients in the validation cohort. Abbreviations: DC, dendritic cells; NK, natural killer; PTPRC, protein tyrosine phosphatase receptor type C; tSNE, t-distributed stochastic neighbor embedding.
FIGURE 2
FIGURE 2
T lymphocyte components in HBV+ HCC and HBV− HCC tumor environments. (A) T-SNE plot showing the annotation and color codes for T cell subclusters. (B) Heat map showing the canonically expressed genes of the 5 T cell clusters. Data were from CSE0000008. (C) Violin plot presenting the expression of CD103 (ITGAE) in different T cell clusters. (D) T-SNE plot showing the annotation and color codes for two CD8+ T cell subclusters. E. Dot plot showing the expression of canonically expressed genes in two subclusters. The circle size represents the ratio of expression, while the color darkness represents the log-transformed mean expression. Data were from CSE0000008. (F) Pseudotime-ordered analysis of CD8+ T cells from HBV+ HCC and HBV− samples. CD8+ T cell subtypes are labeled by colors. (G) Heat map showing the dynamic of cytotoxic genes or exhausted genes. Abbreviations: ITGAE, integrin subunit alpha E; MAIT, mucosa-associated invariant T; TREG, regulatory T; tSNE, T-distributed stochastic neighbor embedding.
FIGURE 3
FIGURE 3
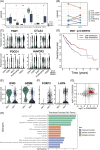
Different features between HBV+ HCC and HBV− HCC in T cell clusters. (A) Box plot showing the proportion of T cell clusters between HBV+ HCC and HBV− HCC. The proportion was compared by t test. *p<0.05; **p<0.01; ***p<0.001. (B) Line chart showing the rate of T cell clusters in tumors of HBV+ and HBV− patients with HCC. (C) Violin plot presenting the expression of immune checkpoint genes of 5 subclusters in HBV+ HCC and HBV− HCC. The expression was compared by t test and ns means no significance. (D) Kaplan-Meier analysis shows the overall patient survival profiles based on a high or low score of MAIT cells (log-rank test). The expression of MAIT cells was divided into 2 groups according to the median infiltration score. The risk classification is indicated in the figure. (E) Violin plot presenting the expression of IFNG and GZMB of proliferating T cells in HBV+ HCC and HBV− HCC. (F) Violin plot presenting the expression of FOXP3 and LAYN of TREG cells in HBV+ HCC and HBV− HCC. (G) Volcano plot showing the upregulated and downregulated genes between 2 kinds of HCC in GSE140228 and CSE0000008. (H) Bar graph showing the result of enriched GO in terms of upregulated genes. Different classifications were labeled with different colors. Abbreviations: GO, Gene Ontology; MAIT, mucosa-associated invariant T; TREG, regulatory T.
FIGURE 4
FIGURE 4
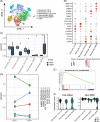
Myeloid cell components in HBV+ HCC and HBV− HCC tumor environments. (A) T-SNE plot showing the annotation and color codes for 5 myeloid cell subclusters and an unannotated cluster. (B) Dot plot showing the expression of canonically expressed genes in 5 myeloid subclusters. The circle size represents the ratio of expression, while the color darkness represents the log-transformed mean expression. Data were from CSE0000008. (C) Box plot showing the proportion of myeloid cell clusters between HBV+ HCC and HBV− HCC. The proportion was compared by t test. *p<0.05; **p<0.01; ***p<0.001. (D) Line chart showing the rate of myeloid cell clusters in tumors of HBV+ and HBV− patients with HCC. (E) The result of enrichment on the M1 polarization gene set. Macrophage_MMP9 shows high enrichment. (F) Violin plot presenting the expression of HLA-DQA2 and HLA-DPB1 of 5 myeloid subclusters in HBV+ HCC and HBV− HCC. Abbreviation: HLA, human leukocyte antigen; tSNE, T-distributed stochastic neighbor embedding.
FIGURE 5
FIGURE 5
Difference analysis of Macropahge_MMP9 and NK cells between HBV+ HCC and HBV− HCC. (A) Volcano plot showing the upregulated and downregulated genes of Macrophage_MMP9 between 2 kinds of HCC in both GSE140228. (B) Bar graph showing the result of KEGG enrichment. (C) Bar graph showing the result of GO enrichment. Different classifications were labeled with different colors. (D) Dot plot showing the expression of cytotoxic genes and exhausted genes of NK cells from HBV+ HCC and HBV− HCC. The circle size represents the ratio of expression, while the color darkness represents the log-transformed mean expression. Data were from CSE0000008. Abbreviations: GO, Gene ontology; HLA, human leukocyte antigen; KEGG, kyoto encyclopedia of genomes and genomes; NS, no significance.
FIGURE 6
FIGURE 6
Cell-cell communication between immune subclusters in HBV+ HCC and HBV− HCC. (A) Circos plots showing the top 50 predicted cell-cell interaction axes between different clusters. Data were from CSE0000008. (B) Dot plot showing the upregulated suppressive cell-cell interactions toward CD8+ T cells. The circle size represents the count of −log10 (q-value), while the color darkness represents the log2foldchang between HBV+ HCC and HBV− HCC. The upper one was from GSE140228 and the lower one was from CSE0000008. (C) Dot plot showing the upregulated suppressive cell-cell interactions from TREG cells. The circle size represents the count of −log10 (q-value), while the color darkness represents the log2foldchang between HBV+ HCC and HBV− HCC. The left one was from GSE140228 and the right one was from CSE0000008. Abbreviations: DC, dendritic cells; HLA, human leukocyte antigen; NK, natural killer; MAIT, mucosa-associated invariant T; TREG, regulatory T; tSNE, T-distributed stochastic neighbor embedding.
FIGURE 7
FIGURE 7
Difference between HBV+ HCC and HBV− HCC change in ICB. (A) T-SNE plot showing the annotation and color codes for cells from 4 different groups. (B) Volcano plot showing the upregulated and downregulated genes of HBV− HCC (H58) after ICB. (C) Volcano plot showing the upregulated and downregulated genes of HBV+ HCC (H68 and H73) after ICB. (D) Line charts showing the rate of T cell clusters in tumors of HBV+ and HBV− patients with HCC with or without ICB. (E) Violin plot presenting the expression of exhausted markers of T cells in 4 kinds of HCC. The expression was compared by t test and ns means no significance. *p<0.05; **p<0.01; ***p<0.001. (F) Violin plot presenting the expression of FOXP3 and LYAN of TREG cells in 4 kinds of HCC. (G) Line chart showing the rate of myeloid cell clusters in tumors of HBV+ and HBV− patients with HCC with or without ICB. (F) Violin plot presenting the expression of HLA-DQA1 and HLA-DPB1 of macrophages in 4 kinds of HCC. Abbreviations: ICB, immune checkpoint blockade; MAIT, mucosa-associated invariant T; TREG, regulatory T; tSNE, T-distributed stochastic neighbor embedding.

References

    1. El-Serag HB. Epidemiology of viral hepatitis and hepatocellular carcinoma. Gastroenterology. 2012;142:1264–73. e1261. - PMC - PubMed
    1. Venook AP, Papandreou C, Furuse J, de Guevara LL. The incidence and epidemiology of hepatocellular carcinoma: A global and regional perspective. Oncologist. 2010;15(suppl 4):5–13. - PubMed
    1. Levrero M, Zucman-Rossi J. Mechanisms of HBV-induced hepatocellular carcinoma. J Hepatol. 2016;64:S84–101. - PubMed
    1. Chen Y, Tian Z. HBV-Induced immune imbalance in the development of HCC. Front Immunol. 2019;10:2048. - PMC - PubMed
    1. Feng Z-Y, Xu F-G, Liu Y, Xu H-J, Wu F-B, Chen X-B, et al. . The immune microenvironment and progression of immunotherapy and combination therapeutic strategies for hepatocellular carcinoma. Hepatoma research. 2021;7:1192506.

Publication types