. 2024 Feb 7;20(6):1347-1360.
doi: 10.1039/d3sm01161e.

Interfacial rheology of linearly growing polyelectrolyte multilayers at the water-air interface: from liquid to solid viscoelasticity

Affiliations

Interfacial rheology of linearly growing polyelectrolyte multilayers at the water-air interface: from liquid to solid viscoelasticity

Stéphane Pivard et al. Soft Matter. .

Abstract

Despite the long history of investigations of polyelectrolyte multilayer formation on solid or liquid surfaces, important questions remain open concerning the construction of the first set of layers. These are generally deposited on a first anchoring layer of different chemistry, influencing their construction and properties. We propose here an in-depth investigation of the formation of NaPSS/PAH multilayers at the air/water interface in the absence of a chemically different anchoring layer, profiting from the surface activity of NaPSS. To analyse the mechanical properties of the different layers, we combine recently established analysis techniques of an inflating/deflating bubble exploiting simultaneous shape and pressure measurement: bubble shape elastometry, general stress decomposition and capillary meniscus dynanometry. We complement these measurements by interfacial shear rheology. The obtained results allow us to confirm, first of all, the strength of the aforementioned techniques to characterize complex interfaces with non-linear viscoelastic properties. Furthermore, their sensitivity allows us to show that the multilayer properties are highly sensitive to the temporal and mechanical conditions under which they are constructed and manipulated. We nevertheless identify a robust trend showing a clear transition from a liquid-like viscoelastic membrane to a solid-like viscoelastic membrane after the deposition of 5 layers. We interpret this as the number of layers required to create a fully connected multilayer, which is consistent with previous results obtained on solid or liquid interfaces.


Conflict of interest statement

There are no conflicts to declare.

Figures
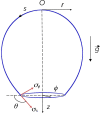
Fig. 1
Fig. 1. Definition of the cylindrical coordinates used to parametrize the bubble shape. The stresses σs and σϕ along the two principal directions are also shown.
Fig. 2
Fig. 2. Effect of NaPSS monomer concentration on the dynamic surface tension during the adsorption of the first NaPSS layer: the ionic strength is fixed by the added salt concentration, [NaCl] = 0.15 M.
Fig. 3
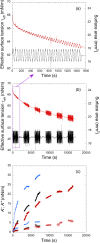
Fig. 3. Dilatometry experiments during the adsorption of the first NaPSS layer, the surface area value being periodically modulated by a sine wave with amplitude λ0 = 0.05 = 5% and frequency f = 0.02 Hz: (a) zoom on the first 1500 s of the experiment in (b), where we plot the time dependence of effective surface tension (red) and bubble surface area (black). (c) Time dependence of the elastic and viscous dilatational moduli K′ (closed symbols) and K′′ (open symbols) for three experiments. Intervals between groups of points correspond to temporal sequences with no strain oscillations applied to the bubble, the red points correspond to the experiment in (a) and (b) ([NaPSS] = 4.8 mM).
Fig. 4
Fig. 4. Typical evolution of Lissajous curves (obtained after sinusoidal variation of the surface area with amplitude λ0 = 0.05 = 5% and frequency f = 0.02 Hz) as layers of oppositely charged polyelectrolytes are added: (a) total effective surface tension γeff, (b)–(e) components τi. The meaning of the symbols remains the same for all plots.
Fig. 5
Fig. 5. Increase of the elastic and viscous dilatational moduli K′ (closed symbols) and K′′ (open symbols) with the number of polyelectrolyte layers for four experiments using sinusoidal deformation of the surface area with amplitude λ0 = 0.05 = 5% and frequency f = 0.02 Hz. Numbers in the legend correspond to the duration of the first NaPSS layer adsorption step and to the number of oscillations applied to the bubble for the measurement. Lines are guides for the eye.
Fig. 6
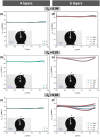
Fig. 6. Profiles of the principal stresses σs et σϕ for different values of the area deformation λA obtained after continuous deflation at a rate of 0.05 mm3 s−1 after the adsorption of four layers (left) and after the adsorption of the fifth polyelectrolyte layer (right). Only the left profiles are plotted in the left column since the axial symmetry is preserved for this number of layers. For this sample, the adsorption time of the first NaPSS layer was 20 min (green points in Fig. 5) and the deflation/inflation experiment was done before the sinusoidal deformations.
Fig. 7
Fig. 7. Values of the dilatational (K′) and shear (G′) elastic moduli, obtained by using eqn (6) as described in Section 2.5.4 with a bubble progressively deflated at a rate of 0.05 mm3 s−1, as a function of deflation ratio λA, for increasing number of deposited layers. Values for 0.95 <λA < 1 are strongly fluctuating because of a lack of numerical resolution for these small deformations of the bubble and are not shown.
Fig. 8
Fig. 8. Average values of the dilatational (K′) and shear (G′) elastic moduli as a function of number of deposited layers. Averages are calculated from all the data shown in Fig. 7 and errors bars correspond to standard deviation. The green squares correspond to K′ values measured on the same bubble by oscillatory dilatation (Fig. 5).
Fig. 9
Fig. 9. Temporal evolution of G′ (closed symbols) and G′′ (open symbols) measured on a NaPSS/PAH bilayer during a complex shear history including three time sweeps (I, II, V: f = 0.01 Hz, λ0 = 0.08%, dots) and two amplitude sweeps (III, IV: f = 0.01 Hz, 0.01% < λ0 < 5%, diamonds) separated by rest intervals (shaded time intervals 1, 2, 3 and 4). The experiment started 120 min after the exchange of PAH by saline solution.
Fig. 10
Fig. 10. Values of G′ (closed symbols) and G′′ (open symbols) measured in strain amplitude sweeps. Data from the experiment in Fig. 9 (f = 0.01 Hz). The increasing amplitude sweep (III, blue points) and the decreasing amplitude sweep (IV, red points) are separated by a rest time of 10 000 s.
Fig. 11
Fig. 11. Effect of the shear history on the growth of G′ (closed symbols) and G′′ (open symbols) after the replacement of PAH solution by the saline solution: no waiting time, at f = 0.01 Hz (blue points) or f = 1 Hz (red points); waiting 3600 s before starting the measurement at f = 0.01 Hz (black points). For all the experiments, the relaxation of the first NaPSS layer has proceeded for 120 min and the strain amplitude is λ0 = 0.08%.
Fig. 12
Fig. 12. Effect of relaxation time of the first NaPSS layer on the growth of G′ (closed symbols) and G′′ (open symbols): 120 min (blue points) and 5 min (black points) (f = 0.01 Hz, strain amplitude λ0 = 0.08%).
Fig. 13
Fig. 13. Evolution of the moduli G′ (closed symbols) and G′′ (open symbols) of the interface as bilayers are progressively added. The first NaPSS layer has relaxed for 120 min before the addition of the first PAH layer. (a) Initial growth f = 001 Hz, strain amplitude = 0.08%. (b) Frequency sweeps, strain amplitude = 0.08%. Points: increasing frequency sweep; lines: decreasing frequency sweep. (c) Strain amplitude sweep, f = 0.01 Hz. Points: increasing amplitude sweeps; lines: decreasing amplitude sweeps.

References

    1. Decher G. Hong J. D. Schmitt J. Thin Solid Films. 1992;210–211:831–835. doi: 10.1016/0040-6090(92)90417-A. - DOI
    1. Jaber J. A. Schlenoff J. B. Curr. Opin. Colloid Interface Sci. 2006;11:324–329. doi: 10.1016/j.cocis.2006.09.008. - DOI
    1. Shchukina E. M. Shchukin D. G. Curr. Opin. Colloid Interface Sci. 2012;17:281–289. doi: 10.1016/j.cocis.2012.06.003. - DOI
    1. Priolo M. A. Holder K. M. Guin T. Grunlan J. C. Macromol. Rapid Commun. 2015;36:866–879. doi: 10.1002/marc.201500055. - DOI - PubMed
    1. Das B. P. Tsianou M. Adv. Colloid Interface Sci. 2017;244:71–89. doi: 10.1016/j.cis.2016.12.004. - DOI - PubMed