. 2024 Jan 22;81(1):50.
doi: 10.1007/s00018-023-05084-0.

FOXA2-initiated transcriptional activation of INHBA induced by methylmalonic acid promotes pancreatic neuroendocrine neoplasm progression

Affiliations

FOXA2-initiated transcriptional activation of INHBA induced by methylmalonic acid promotes pancreatic neuroendocrine neoplasm progression

Chunhua Hu et al. Cell Mol Life Sci. .

Abstract

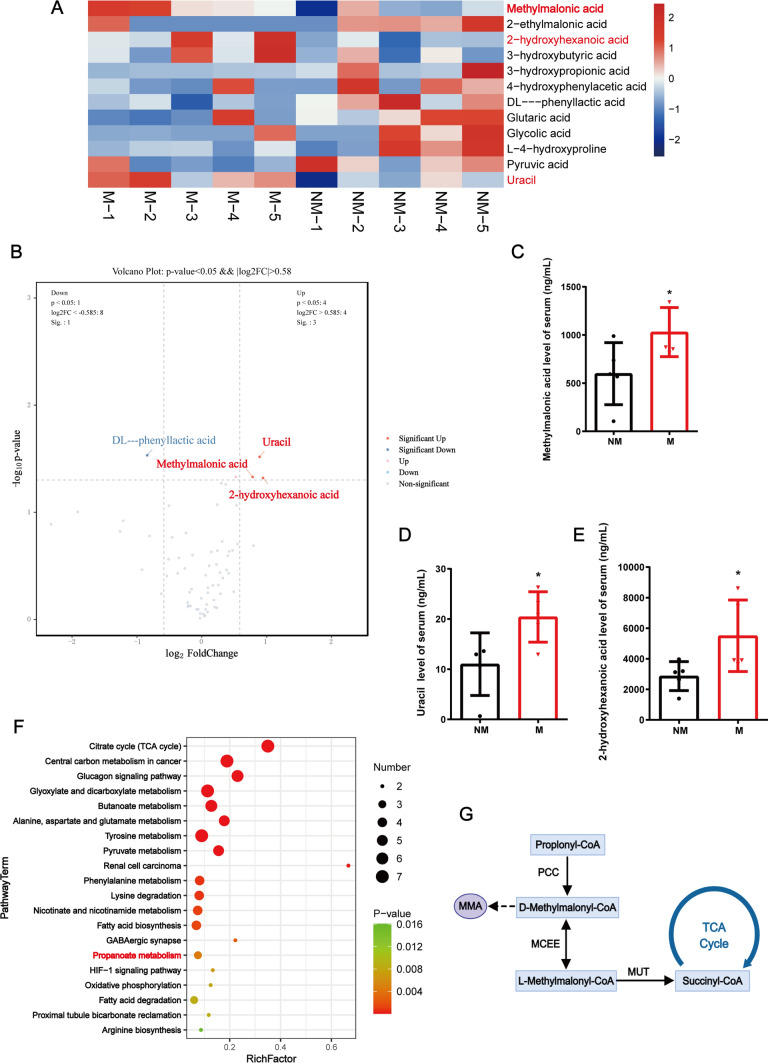
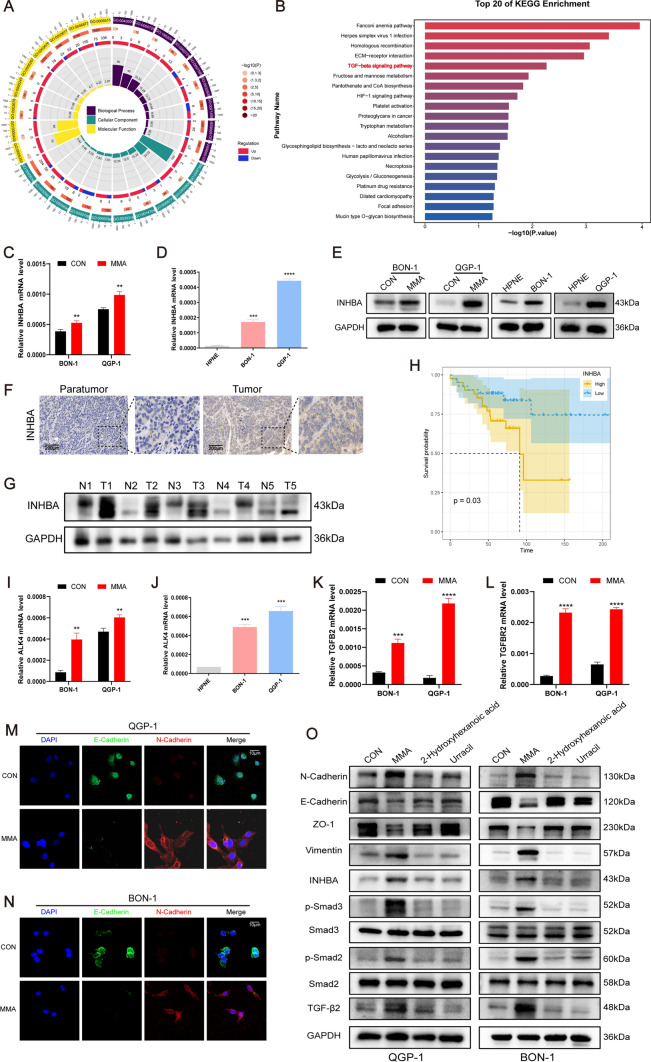
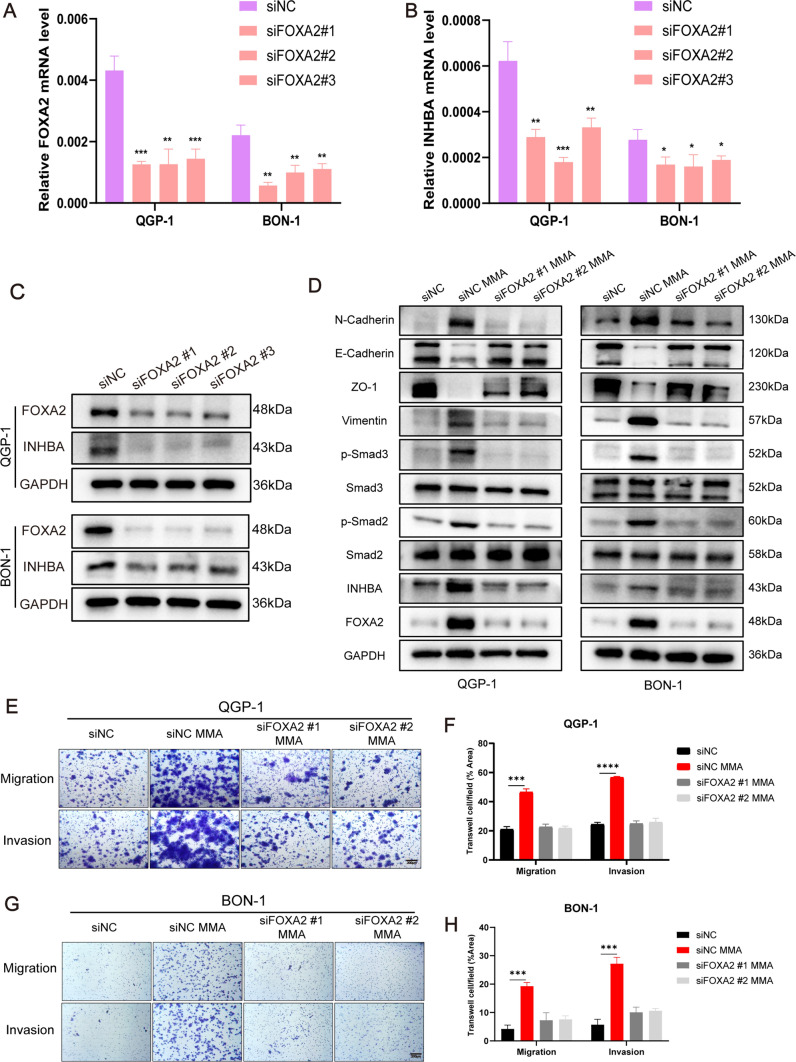
Pancreatic neuroendocrine neoplasms (PanNENs) are a group of highly heterogeneous neoplasms originating from the endocrine islet cells of the pancreas with characteristic neuroendocrine differentiation, more than 60% of which represent metastases when diagnosis, causing major tumor-related death. Metabolic alterations have been recognized as one of the hallmarks of tumor metastasis, providing attractive therapeutic targets. However, little is known about the molecular mechanism of metabolic changes regulating PanNEN progression. In this study, we first identified methylmalonic acid (MMA) as an oncometabolite for PanNEN progression, based on serum metabolomics of metastatic PanNEN compared with non-metastatic PanNEN patients. One of the key findings was the potentially novel mechanism of epithelial-mesenchymal transition (EMT) triggered by MMA. Inhibin βA (INHBA) was characterized as a key regulator of MMA-induced PanNEN progression according to transcriptomic analysis, which has been validated in vitro and in vivo. Mechanistically, INHBA was activated by FOXA2, a neuroendocrine (NE) specific transcription factor, which was initiated during MMA-induced progression. In addition, MMA-induced INHBA upregulation activated downstream MITF to regulate EMT-related genes in PanNEN cells. Collectively, these data suggest that activation of INHBA via FOXA2 promotes MITF-mediated EMT during MMA inducing PanNEN progression, which puts forward a novel therapeutic target for PanNENs.

Keywords: Epithelial–mesenchymal transition; FOXA2; INHBA; Metabolic alterations; Pancreatic neuroendocrine neoplasm; Tumor progression.


Conflict of interest statement

The authors declare no competing financial interests.

Figures

Fig. 1
Fig. 1
Identification of metabolites associated with PanNEN metastasis based on serum metabolomics analysis. A Heat map presents candidate metabolites with more than 1.5-fold change between PanNEN patients with metastasis (M) and non-metastatic PanNEN (NM), based on serum metabolomics analysis (n = 5 biologically independent samples). The red font represents significantly elevated metabolites. B Volcano plot summarizes the serum metabolomics analysis of PanNEN serum samples used in this study. C–E Comparison of serum metabolite concentrations in samples from metastatic (M) and non-metastatic PanNENs (NM). F Bubble map of metabolic pathway enrichment (Top 20). G Schematic representation of propanoate metabolism
Fig. 2
Fig. 2
MMA promotes proliferation, migration, and invasion of PanNEN cells. A–G The effects of the three significantly elevated metabolites on cell proliferation were tested by cell counting CCK-8 assay (A, B), colony formation (C, D), and EDU assays (E–G) in QGP-1 and BON-1 cells. H–K Transwell assays indicated that only MMA significantly increased cell migration and invasion in both QGP-1 (H) and BON-1 (J) cells compared with the control groups. Statistics of migration and invasion cells in the transwell assays after treatment for 48 h were analyzed (I, K)
Fig. 3
Fig. 3
MMA increases the expression of INHBA and EMT markers. A GO analysis of RNA seq results showed that MMA might participate in various biological processes. B KEGG analyses of RNA‐seq data in MMA-induced and control groups (Top 20 enriched pathways). C QPCR was performed to detect the relative expression of INHBA in MMA-treated and the control group in QGP-1 and BON-1 cells. D The relative expression of INHBA in human normal pancreatic cells (HPNE) and PanNEN cells (QGP-1 and BON-1) was detected by qPCR assay. E The expression of INHBA in indicated groups was evaluated by western blotting. F Typical images of INHBA IHC staining in PanNEN tumor tissues and adjacent normal tissues. G Western blots indicated that the expression of INHBA was increased in PanNEN tumor tissues compared with that in the adjacent normal tissues of PanNEN patients. T tumors; N adjacent normal tissues. H Patients with high INHBA expression had lower overall survival probabilities in PanNEN patients. I The relative expression of ALK4 in MMA-treated and the control group in QGP-1 and BON-1 cells. J The relative expression of ALK4 in human normal HPNE and PanNEN cells (QGP-1 and BON-1) was detected by qPCR assay. K, L The relative expression of TGFB2 (K) and TGFBR2 (L) in MMA-treated and the control group in QGP-1 and BON-1 cells. M, N Typical IF images of the expression of E-cadherin and N-cadherin for QGP-1 cell lines (M) and BON-1 cells (N). O Western blots showed that only MMA induced EMT and increased the expression of INHBA, TGF-β2, p-Smad2, and p-Smad3 among the three upregulated metabolites
Fig. 4
Fig. 4
INHBA mediates MMA-induced aggressiveness in PanNEN cells. A, B INHBA levels in QGP-1 (A) and BON-1 cells (B) transfected with shRNA lentivirus against INHBA or negative control were evaluated by qPCR. C Immunoblots of INHBA expression in QGP-1 and BON-1 cells transfected with shRNA lentivirus against INHBA or negative control. D Immunoblots of QGP-1 and BON-1 cells with INHBA knockdown and treated with 5 mM MMA for 10 days. E–F Typical IF images of the expression of E-cadherin and INHBA for QGP-1 cell lines (E) and BON-1 cells (F). G-J Transwell migration/invasion assays of QGP-1 (G, H) and BON-1 (I, J) cells
Fig. 5
Fig. 5
MMA promotes PanNEN progression through INHBA upregulation in vivo. A Schematic diagram of the MMA regimen in mice with subcutaneous PanNENs and general view of PanNEN tumorigenesis in nude mice subcutaneously injected with QGP-1 cells treated with ddH2O, MMA, and MMA stimulation after INHBA knockdown. n = 4 mice per group. B, C Volume (B) and weight (C) of subcutaneous tumor of nude mice in three groups. D The serum MMA levels of mice after being fed with MMA water compared with the control group. E Typical images of IHC staining with Ki67 and INHBA in subcutaneous tumor of nude mice in three groups. F Immunoblots of INHBA, p-Smad2, and p-Smad3 expression in subcutaneous tumor of three groups. G Schematic diagram of the MMA regimen in mice with tail vein injection and representative images of liver metastases in nude mice 8 weeks after injection through tail vein of MMA-treated and control groups. n = 5 mice per group. H The serum MMA levels of mice after being fed with MMA water compared with the control group. I Number of liver metastasis in MMA-treated and control groups. J Typical IF images of the expression of E-cadherin and N-cadherin for liver metastatic nodules of MMA-treated and control groups. K Immunoblots of EMT markers, TGF-β2, p-Smad2, and p-Samd3 expression in liver metastatic nodules of MMA-treated and control groups. L Immunoblots of INHBA expression in liver metastatic nodules of MMA-treated and control groups. M Typical images of INHBA IHC staining in liver metastatic nodules of MMA-treated and control nude mice
Fig. 6
Fig. 6
Upregulation of INHBA induced by MMA is the target of transcription factor FOXA2. A QPCR was used to evaluate the relative expression of potential transcription factors for INHBA in MMA-induced QGP-1 cells. B Immunoblots of SOX9 and FOXA2 expression in indicated groups. C The JASPAR score of potential transcription factors, FOXA2 and SOX9, binding to the INHBA promoter region. D Schematic diagram demonstrated the potential FOXA2 binding sequence in the INHBA promoter region predicted by JASPAR. E ChIP-qPCR analysis of FOXA2 binding to INHBA promoter in QGP-1 cells treated with ddH2O and MMA. F Dual luciferase reporter assay for detecting the activity of wild-type or mutant INHBA promoters in QGP-1 cells which were transfected with FOXA2 overexpression or vector lentivirus. G–J QPCR was performed to detect the efficiency of FOXA2 overexpression and the expression of INHBA in FOXA2 overexpressing groups compared with the control group in QGP-1 (G, I) and BON-1 cells (H, J). K Western blots indicated that FOXA2 overexpression significantly increased the expression of INHBA in QGP-1 and BON-1 cells
Fig. 7
Fig. 7
FOXA2 knockdown decreases INHBA expression and MMA/INHBA-mediated aggressiveness in PanNEN cells. A, B FOXA2 and INHBA levels in QGP-1 and BON-1 cells transfected with FOXA2 siRNA or Scramble siRNA were evaluated by qPCR. C Immunoblots of FOXA2 and INHBA expression in QGP-1 and BON-1 cells transfected with FOXA2 siRNA or Scramble siRNA. D Immunoblots of QGP-1 and BON-1 cells with FOXA2 knockdown and treated with 5 mM MMA for 10 days. E–H Transwell migration/invasion assays of QGP-1 (E, F) and BON-1 (G, H) cells
Fig. 8
Fig. 8
INHBA upregulation by MMA induces MITF-mediated EMT, migration, and invasion in PanNEN cells. A MITF levels in QGP-1 and BON-1 cells transfected with INHBA shRNA or Scramble shRNA were evaluated by qPCR. B Immunoblots of INHBA and MITF expression in QGP-1 and BON-1 cells transfected with INHBA shRNA or Scramble shRNA. C MITF expression was evaluated in QGP-1 and BON-1 cells transfected with INHBA overexpression or vector lentivirus by qPCR. D Western blots indicated that INHBA overexpression significantly increased the expression of MITF in QGP-1 and BON-1 cells. E MITF levels in QGP-1 and BON-1 cells transfected with MITF siRNA or Scramble siRNA were evaluated by qPCR. F Immunoblots of MITF expression in QGP-1 and BON-1 cells transfected with MITF siRNA or Scramble siRNA. G Immunoblots of QGP-1 and BON-1 cells with MITF knockdown and treated with 5 mM MMA for 10 days. HK Transwell migration/invasion assays of QGP-1 (H, I) and BON-1 (J, K) cells

Similar articles

Cited by

References

    1. Sun J. Pancreatic neuroendocrine tumors. Intractable Rare Dis Res. 2017;6(1):21–28. doi: 10.5582/irdr.2017.01007. - DOI - PMC - PubMed
    1. Gordon-Dseagu VL, et al. Pancreatic cancer incidence trends: evidence from the surveillance, epidemiology and end results (SEER) population-based data. Int J Epidemiol. 2018;47(2):427–439. doi: 10.1093/ije/dyx232. - DOI - PMC - PubMed
    1. Lee MR, et al. Incidence trends of gastroenteropancreatic neuroendocrine tumors in the United States. Clin Gastroenterol Hepatol. 2019;17(11):2212–2217 e1. doi: 10.1016/j.cgh.2018.12.017. - DOI - PubMed
    1. Roland CL, et al. Survival impact of malignant pancreatic neuroendocrine and islet cell neoplasm phenotypes. J Surg Oncol. 2012;105(6):595–600. doi: 10.1002/jso.22118. - DOI - PMC - PubMed
    1. Frilling A, Clift AK. Therapeutic strategies for neuroendocrine liver metastases. Cancer. 2015;121(8):1172–1186. doi: 10.1002/cncr.28760. - DOI - PubMed