Covid19Vaxplorer: A free, online, user-friendly COVID-19 vaccine allocation comparison tool
- PMID: 38252671
- PMCID: PMC10802966
- DOI: 10.1371/journal.pgph.0002136
Covid19Vaxplorer: A free, online, user-friendly COVID-19 vaccine allocation comparison tool
Abstract
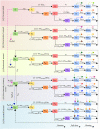
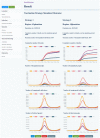
There are many COVID-19 vaccines currently available, however, Low- and middle-income countries (LMIC) still have large proportions of their populations unvaccinated. Decision-makers must decide how to effectively allocate available vaccines (e.g. boosters or primary series vaccination, which age groups to target) but LMIC often lack the resources to undergo quantitative analyses of vaccine allocation, resulting in ad-hoc policies. We developed Covid19Vaxplorer (https://covid19vaxplorer.fredhutch.org/), a free, user-friendly online tool that simulates region-specific COVID-19 epidemics in conjunction with vaccination with the purpose of providing public health officials worldwide with a tool for vaccine allocation planning and comparison. We developed an age-structured mathematical model of SARS-CoV-2 transmission and COVID-19 vaccination. The model considers vaccination with up to three different vaccine products, primary series and boosters. We simulated partial immunity derived from waning of natural infection and vaccination. The model is embedded in an online tool, Covid19Vaxplorer that was optimized for its ease of use. By prompting users to fill information through several windows to input local parameters (e.g. cumulative and current prevalence), epidemiological parameters (e.g basic reproduction number, current social distancing interventions), vaccine parameters (e.g. vaccine efficacy, duration of immunity) and vaccine allocation (both by age groups and by vaccination status). Covid19Vaxplorer connects the user to the mathematical model and simulates, in real time, region-specific epidemics. The tool then produces key outcomes including expected numbers of deaths, hospitalizations and cases, with the possibility of simulating several scenarios of vaccine allocation at once for a side-by-side comparison. We provide two usage examples of Covid19Vaxplorer for vaccine allocation in Haiti and Afghanistan, which had as of Spring 2023, 2% and 33% of their populations vaccinated, and show that for these particular examples, using available vaccine as primary series vaccinations prevents more deaths than using them as boosters.
Copyright: © 2024 Trejo et al. This is an open access article distributed under the terms of the Creative Commons Attribution License, which permits unrestricted use, distribution, and reproduction in any medium, provided the original author and source are credited.
Conflict of interest statement
The authors have declared that no competing interests exist.
Figures


Update of
-
Covid19Vaxplorer: a free, online, user-friendly COVID-19 Vaccine Allocation Comparison Tool.medRxiv [Preprint]. 2023 Nov 11:2023.06.15.23291472. doi: 10.1101/2023.06.15.23291472. medRxiv. 2023. Update in: PLOS Glob Public Health. 2024 Jan 22;4(1):e0002136. doi: 10.1371/journal.pgph.0002136. PMID: 37986918 Free PMC article. Updated. Preprint.
References
-
- WHO. WHO Coronavirus (COVID-19) Dashboard;. https://covid19.who.int/?adgroupsurvey=adgroupsurvey&gclid=CjwKCAjw_YShB....
-
- Higdon MM, Wahl B, Jones CB, Rosen JG, Truelove SA, Baidya A, et al.. A Systematic Review of Coronavirus Disease 2019 Vaccine Efficacy and Effectiveness Against Severe Acute Respiratory Syndrome Coronavirus 2 Infection and Disease. Open Forum Infect Dis. 2022;9(6):ofac138. doi: 10.1093/ofid/ofac138 - DOI - PMC - PubMed
-
- Bracis C, Burns E, Moore M, Swan D, Reeves DB, Schiffer JT, et al.. Widespread testing, case isolation and contact tracing may allow safe school reopening with continued moderate physical distancing: A modeling analysis of King County, WA data. Infect Dis Model. 2021;6:24–35. doi: 10.1016/j.idm.2020.11.003 - DOI - PMC - PubMed
Grants and funding
LinkOut - more resources
Full Text Sources
Miscellaneous
