. 2024 Mar;627(8003):389-398.
doi: 10.1038/s41586-024-07066-z. Epub 2024 Jan 22.

Deciphering cell states and genealogies of human haematopoiesis

Affiliations

Deciphering cell states and genealogies of human haematopoiesis

Chen Weng et al. Nature. 2024 Mar.

Abstract

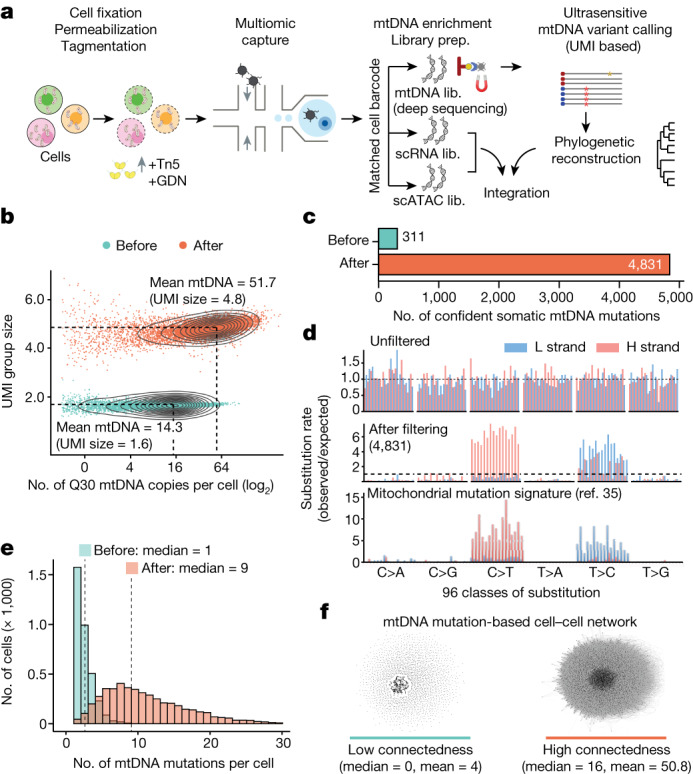
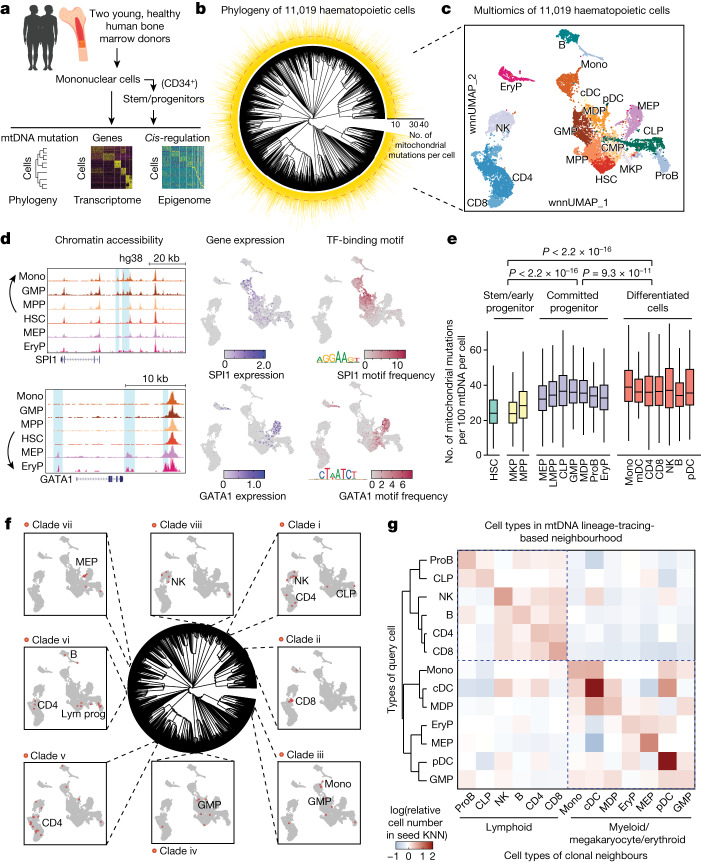
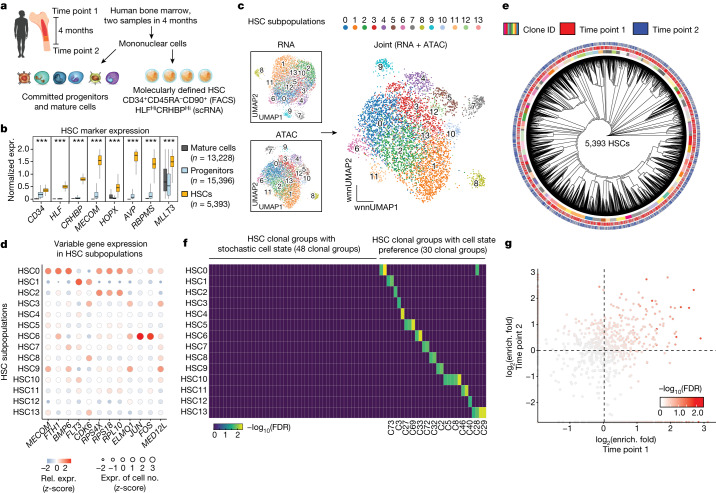
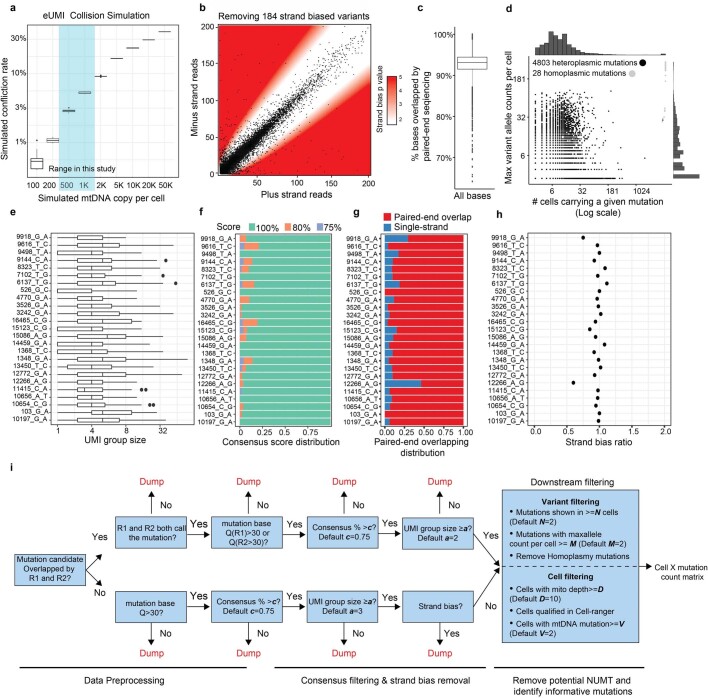
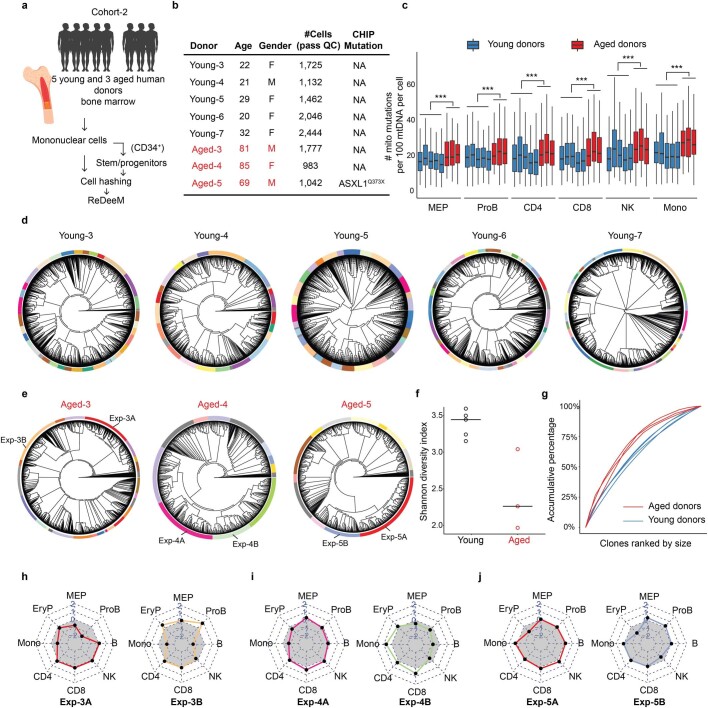
The human blood system is maintained through the differentiation and massive amplification of a limited number of long-lived haematopoietic stem cells (HSCs)1. Perturbations to this process underlie diverse diseases, but the clonal contributions to human haematopoiesis and how this changes with age remain incompletely understood. Although recent insights have emerged from barcoding studies in model systems2-5, simultaneous detection of cell states and phylogenies from natural barcodes in humans remains challenging. Here we introduce an improved, single-cell lineage-tracing system based on deep detection of naturally occurring mitochondrial DNA mutations with simultaneous readout of transcriptional states and chromatin accessibility. We use this system to define the clonal architecture of HSCs and map the physiological state and output of clones. We uncover functional heterogeneity in HSC clones, which is stable over months and manifests as both differences in total HSC output and biases towards the production of different mature cell types. We also find that the diversity of HSC clones decreases markedly with age, leading to an oligoclonal structure with multiple distinct clonal expansions. Our study thus provides a clonally resolved and cell-state-aware atlas of human haematopoiesis at single-cell resolution, showing an unappreciated functional diversity of human HSC clones and, more broadly, paving the way for refined studies of clonal dynamics across a range of tissues in human health and disease.


Conflict of interest statement

C.W., J.S.W. and V.G.S. are listed as inventors on a patent application covering the ReDeeM method. V.G.S. is an inventor on PCT/US2019/036583 covering the application of lineage tracing with mitochondrial genome mutations. V.G.S. serves as an advisor to and/or has equity in Branch Biosciences, Ensoma, Novartis and Cellarity. J.S.W. serves as an advisor to and/or has equity in 5 AM Ventures, Amgen, Chroma Medicine, KSQ Therapeutics, Maze Therapeutics, Tenaya Therapeutics and Tessera Therapeutics. The other authors declare no competing interests.

Figures

Fig. 1
Fig. 1. Single-cell deep mtDNA mutation detection with joint multiomics.
a, Schematic of ReDeeM workflow. GDN, 1% glyco-diosgenin (Methods). b, Comparison of mtDNA copy number and UMI group size per cell before and after mtDNA enrichment. UMI group size is the number of raw reads in each UMI group. Q30, sequencing quality score of 30 or above (accuracy ≥99.9%). c, Comparison of the total number of confident mtDNA mutations in 7,104 cells before mtDNA enrichment (via the mgatk package) and after (via UMI consensus calling). d, Mutational signatures in each class of mononucleotide and trinucleotide change by heavy (H) and light (L) strands under the optimized protocol. Mutational signatures are compared across unfiltered (top), 4,831 mtDNA mutations via UMI consensus calling (middle) and a previously reported mtDNA mutational signature in bulk (bottom, adapted from ref. ). e, Distribution of the number of confident mtDNA mutations per cell before (via mgatk) and after mtDNA enrichment (via UMI consensus calling). f, Network connectedness analysis before (via mgatk, left) and after mtDNA enrichment (via UMI consensus calling, right). Each dot represents one cell and each line connects cells with shared mutations. Connectedness is defined as the number of ‘neighbour’ cells sharing at least one mtDNA mutation with any given cell. Lib., library.
Fig. 2
Fig. 2. Fine-scale lineage tracing with simultaneous state profiling for human haematopoiesis at steady state.
a, Schematic of the ReDeeM experiment for human haematopoietic cells. b, Phylogenetic tree for haematopoietic cells of donor young-1, based on shared mtDNA mutations using the neighbour-joining algorithm. The numbers of shareable mtDNA mutations for each cell are indicated, with a median of ten (cladograms are used for tree visualization in this manuscript). c, Joint multiomics clustering of young-1 (for the same cells from b). Weighted nearest-neighbour uniform manifold approximation and projection (wnnUMAP) showing combined ATAC and RNA profile for 11,019 single cells. HSC, haematopoietic stem cell; MPP, multipotent progenitor; MKP, megakaryocyte progenitor; CMP, common myeloid progenitor; GMP, granulocyte–monocyte progenitor; MDP, monocyte–dendritic cell progenitor; MEP, megakaryocytic–erythroid progenitor; CLP, common lymphoid progenitor; LMPP, lympho–myeloid primed progenitor; ProB, B cell progenitor; EryP, erythroid precursor; Mono, monocyte; cDC, conventional dendritic cell; pDC, plasmacytoid dendritic cell; NK, natural killer cell. d, Analysis of chromatin accessibility (pseudo-bulk ATAC, left), mRNA expression (middle) and DNA-binding activity (right) of SPI1 and GATA1 transcription factors (TFs) in HSCs differentiating towards myeloid versus mega-erythroid trajectories. Deviation of transcription factor DNA-binding motif frequency was computed using ChromVar based on the JASPAR2020 human transcription factor database. e, Measurement of mtDNA mutation burdens across different cell types; n = 11,019 cells. Boxplot shows data from the 25th–75th percentile and whiskers extending to the minimum and maximum within 1.5× interquartile range (IQR). P values were derived from two-sided Wilcoxon rank-sum test. f, Integrative analysis between phylogenetic tree- and multiomics-based cell types. Examples of cell-type-restricted local clades are highlighted (clades i–viii). Enrichment P values were computed by one-sided binomial test followed by q-value correction. g, Analysis of cell-type origins based on lineage-informative mtDNA mutations (11,009 cells versus 631 variants). Colour intensity indicates the proportion of each target cell type (x axis) within the mtDNA mutation-based k-nearest neighbourhood (KNN) of the queried cell type (y axis).
Fig. 3
Fig. 3. HSC clonal architecture and clonal-dependent cell-state biases.
a, Schematic of the experimental design. Bone marrow samples were obtained from the same individual at two different time points, 4 months apart, and were processed by ReDeeM. HSCs were enriched by fluorescent activated cell sorting (FACS) and further defined by single-cell gene expression (expr.) markers. b, Validation of HSC classification. Gene expression of multiple independent HSC markers is shown; n = 34,017 cells. Boxplot shows data from the 25th–75th percentile and whiskers extending to the minimum and maximum within 1.5 × IQR. ***P < 2.2 × 10−16, derived from one-sided Wilcoxon rank-sum test. c, Subpopulations of HSCs based on single-cell RNA and ATAC profiling alone, and on combined WNN space. d, Examples of differentially expressed genes across HSC subpopulations. e, Phylogenetic tree of HSCs sampled from two time points using shared mtDNA mutations (donor young-1). f, Overlap analysis between HSC clonal groups and HSC state subpopulations using hypergeometric tests. Colour intensity indicates combined enrichment FDR (Supplementary Data 4). g, Comparison of HSC clone-in-state enrichment (enrich.) (as in f) across the two time points; enrichment fold change is compared. Colour intensity indicates combined enrichment FDR.
Fig. 4
Fig. 4. HSC clonal output activity and lineage biases.
a, Schematic of the strategy that assigns progeny cells to HSC clonal groups using network propagation via mtDNA mutation-based cellular networks. b, Summary of HSC clonal output activity (number of progeny cells from each HSC clone) across two sampling time points in young-1. Progeny numbers are normalized to HSC clone size. c, Correlation analysis of clonal output activity between the two time points (time point 1, T1; time point 2, T2). d, Output contribution from each HSC clone, at both time points, in young-1 and young-2, ranked from highest to lowest contribution to total progeny population. Dashed line indicates the expectation of equal contribution from all clones. e, For each HSC clonal group the percentages of progeny that differentiate into one of the four main lineages are shown: megakaryocyte (MK), lymphoid (Lym), erythroid (Ery) and myeloid (Mye) cells. Clones with consistent enrichment at both time points are grouped as biased clones. The significance of clonal lineage biases is indicated (FDR *0.05–0.20, **0.01–0.05, ***<0.01; Supplementary Data 4 and Methods). Top, fold changes of clonal lineage biases for each clone are indicated for both time points. f, Correlation between HSC clonal output activity and clonal lineage biases. Error bands are 95% confidence level interval for predictions from the linear model. P values derived from Wald test.
Fig. 5
Fig. 5. Clonal structure alterations in human haematopoiesis with ageing.
a, Comparison of mtDNA mutation burden between young and aged donors across different cell types. n = 11,009, 15,101, 9,519 and 14,715 cells in young-1, young-2, aged-1 and aged-2, respectively (yo, years old). Boxplot shows data from the 25th–75th percentile and whiskers extending to the minimum and maximum within 1.5× IQR. ***P < 2.2 × 10−16, derived from one-sided Wilcoxon rank-sum test. b,c, Phylogenetic trees from young (b) and aged donors (c). Clonal groups are indicated by different colours on the outer rings. d, Contribution of each clone to the total population, in two young and two aged donors. e, Shannon diversity index of clonal composition between young and aged donors. f, Mapping single-cell fitness score and cells with LOY on the phylogenetic tree for aged-1. Raw and smoothed LOY cell distribution is shown in outer rings. P values (and FDR using q-value) of LOY enrichment (one-sided binomial test) are shown. g, Cell-type contribution in each expanded clade. Grey area indicates the expected balanced cell-type distribution.
Extended Data Fig. 1
Extended Data Fig. 1. Improved mtDNA coverage and mutation detection with ReDeeM pipeline.
a, Justification of the use of endogenous UMI (eUMI) based on cell barcode plus starting and ending sites through simulation. The starting and ending sites were simulated based on empirical distribution of Tn5 cutting sites. The number of mtDNA copies per cell was simulated (x-axis) and the collision rate was calculated accordingly. n = 10 simulations in each box. Boxplot displays data from the 25th to 75th percentile, and whiskers extending to the minimum and maximum within 1.5 IQR. b-h, Quality controls for ReDeeM variant calling, related to main Fig. 1. b, Removing strand-biased mtDNA variants using a binomial distribution model. White zone includes mutations for which the null hypothesis (no strand biases) holds true, whereas red zone indicates rejection of this null hypothesis (both p < 0.01 and fold change > +/− 2) in favour of strand biases. P-values are derived from two-sided binomial test. c, Percentage of bases that were overlapped by both reads in a paired-end sequencing. n = 7,404 cells. Boxplot displays data from the 25th to 75th percentile, and whiskers extending to the minimum and maximum within 1.5 IQR. d, Summary of the mutations regarding the number of cells carrying the mutation (x-axis) and the maximum number of mutant alleles per cell (y-axis). Heteroplasmic mutations in black dots and homoplasmic mutations in grey dots. e-h, Detailed mutation quality control metrics (random examples are shown). e, The number of supporting reads for each mtDNA molecule (UMI group) containing the mutation. Boxplot displays data from the 25th to 75th percentile, and whiskers extending to the minimum and maximum within 1.5 IQR. f, Consensus score: the percentage of mutant reads in a UMI group. Mutations with consensus scores of less than 75% were discarded. g, For a given mutation, the proportion of molecules that were covered by both reads in a paired-end sequencing. h, Strand bias ratio (a ratio of 1 indicating no strand bias). i, Workflow of the ReDeeM variant calling pipeline. NUMT: Nuclear mitochondrial DNA segments.
Extended Data Fig. 2
Extended Data Fig. 2. eUMI-based error correction via ReDeeM versus conventional mutation detection.
a, The challenge of mtDNA mutation calling using conventional WGS in single colony. b-e, Simulation analysis of mtDNA mutation calling using WGS vs ReDeeM. b, The design of the mtDNA mutations with low heteroplasmy (0.1% ~ 0.5%) for simulation analysis. 10 mutations are randomly picked for each variant allele frequency (VAF). c, Illustration of the simulation analysis process. One single cell with 1000 mtDNA copies is simulated, with the designed mutations from panel a. Next, in silico Tn5 fragmentation followed by artificial sequencing is simulated. The resulting simulated data is analyzed by ReDeeM or conventional mutation calling pipeline. The highlight-1 (Real mutation M) and highligh- 2 (Error) have the same total frequency which can only be distinguished by ReDeeM. d-e, Mutation calling results using conventional WGS in d and the eUMI-based ReDeeM pipeline in e. Also see Supplementary Notes.
Extended Data Fig. 3
Extended Data Fig. 3. Comparative analysis of ReDeeM, mtscATAC, and MAESTER.
a, Comparison of the design and features of ReDeeM, mtscATAC and MAESTER to highlight their similarities and differences. b-d, Comparative analysis of before (as mtscATAC or DOGMA-seq) and after mtDNA enrichment (as ReDeeM), which is exemplified by young-1 HSPC dataset. b, Percentage of total reads mapped to mitochondrial genome per cell, before and after mtDNA enrichment. n = 14,808 cells. Boxplot displays data from the 25th to 75th percentile, and whiskers extending to the minimum and maximum within 1.5 IQR. c, Averaged mitochondrial genome coverage per cell at each position before and after mtDNA enrichment. d, Variant calling before enrichment using mgatk. 311 confident variants are identified. VMR: per mutation variance mean ratio. e-h, Comparative analysis of ReDeeM and MAESTER, which is exemplified by young-2 BMMC dataset. e, Mitochondrial genome coverage by MAESTER. f, mitochondrial genome coverage by ReDeeM. g, Mutational signatures of 307 top mutations by MAESTER, and 4087 variants by ReDeeM. n10 > 10: variants present in at least 10 cells with a VAF of >10%. h, Consistency between ReDeeM and MAESTER. n5 > 2: variants present in at least 5 cells with a VAF of >2%. See Supplementary Notes.
Extended Data Fig. 4
Extended Data Fig. 4. Potential functional impacts of mitochondrial mutations.
a, mtDNA mutation distribution on mitochondrial genome. Top panel: histogram that summarizes the mtDNA mutation numbers across mitochondrial genome. Bottom panel: individual mtDNA mutation coordinates and single-cell heteroplasmy level are shown simultaneously, with 4 categories of mutations: missense, nonsense, synonymous and non-coding. b-c, Mitochondrial genome-wide dN/dS ratio for missense and nonsense mutations in different mutation groups, based on single-cell heteroplasmy levels (as fraction) in b and based on the percentage of cells that carry the mutations in c. The bars indicate the 95% confidence interval. n = 4,837 mtDNA mutations. Asterisks indicates dN/dS ratios where the confidence intervals from dndscv were infinitive. d, Summarise of the number cell-type restricted mtDNA mutations on each of mitochondrial coding genes. e, dN/dS analysis for cell-type restricted mutations. Also see Supplementary Notes. The bars indicate the 95% confidence interval. n = 933 mtDNA mutations.
Extended Data Fig. 5
Extended Data Fig. 5. Validation of ReDeeM lineage tracing via dual-tracer experiment.
a, The design of the dual lineage-tracer experiment with a Kras;Trp53(KP)-drive lung adenocarcinoma lineage-tracing mouse model. CRISPR-based and ReDeeM-based lineage information were analyzed for the same cells. 6 Independent tumours were profiled in batch1 (T1-T6), and 4 tumours were profiled in batch2 (T7-T10). b, CRISPR indel-based lineage relationships were computed with weighted hamming distance and visualized by multidimensional scaling (MDS). Tumour 1 (T1) is shown as an example with 214 single cells. c, Example mtDNA somatic mutations that agree with the CRISPR indel-based MDS map are highlighted. d, Schematic of the Agreement of Closeness (AOC). e, The phylogenetic trees based on mtDNA mutations are illustrated. The “clonal groups” are indicated as the colored bars. The positive AOC ratio for each clonal group is shown within each colored bar. The individual AOC scores (middle) and mutation numbers (bottom) are shown for every single cell (each leaf). The p values are computed by 1000 times permutations (one-sided, Supplementary Methods). The whole tree-level metrics of positive AOC ratios are shown for each tumor below the colored bar. f, Adjusted Rand Index (ARI) for clonal cluster consistency between CRISPR and ReDeeM across 10 tumors (T1-T10). Various clonal cluster resolutions are tested (presented as each dot). n = 16 resolution pairs for each tumor. Boxplot displays data from the 25th to 75th percentile, and whiskers extending to the minimum and maximum within 1.5 IQR. g-h, Illustration of the clonal cluster consistency for T1 (214 single cells) and T9 (410 single cells) on CRISPR-based embedding map using one example cluster resolution. Colors indicate either ReDeeM-based or CRISPR-based cluster identification. Also see Supplementary Methods, Supplementary Figs. 2–3.
Extended Data Fig. 6
Extended Data Fig. 6. Mitochondrial mutation analysis in single colony WGS data.
a, Schematic of the experimental design and reanalysis strategy. b-c, Single colony WGS data quality control. Sequencing coverage on nuclear genome in b, and on mitochondrial genomes in c are shown. Each dot represents one colony. n = 42 colonies. Boxplots display data from the 25th to 75th percentile, and whiskers extending to the minimum and maximum within 1.5 IQR. d, Mitochondrial mutation calling and quality control pipeline for WGS data. e, Mutational signatures in each class of mononucleotide and trinucleotide change by the heavy (H) and light (L) strands. The mtDNA mutations are after step 2 from d and stratified by global VAF (gVAF). n = 2,263 all mutation candidates. f, Categories of the top 5% confident mtDNA mutations. The pie chart shows the proportions of homoplasmic mutations (or appear in all colonies), singular heteroplasmic mutations (or appear only in one colony) as well as heteroplasmic mutations (or appear in a subset of colonies). g, Direct mapping for confident heteroplasmic mtDNA mutations onto the nuclear genome inferred tree. h, mtDNA Mutation similarity (# of shared mutations) within JAK2 mutant clones; within WT clones; or between JAK2 mutant clones and WT clones. I, Mutational signatures for mtDNA mutations identified by ReDeeM in Young-1 HSPC dataset, stratified by gVAF. j, Expected true mtDNA mutational signature. Also see Supplementary Notes.
Extended Data Fig. 7
Extended Data Fig. 7. Single-cell multiomics analyses of HSC subpopulations.
Panel a-g displays data for donor young-1, while h-p for donor young-2. a-e, Identify hematopoietic stem cells (HSC) based on molecular markers for young-1 a, Unsupervised clustering of hematopoietic stem and progenitor cells (CD34+ cells, and CD34+CD45RACD90+ cells) based on joint ATAC and RNA modalities. b, Expression of HLF mRNA level, a molecular marker of HSCs, in each cluster. n = 14,661 cells. Boxplot displays data from the 25th to 75th percentile, and whiskers extending to the minimum and maximum within 1.5 IQR. c, Distribution of HLF expressing levels on wnnUMAP d, Define HSCs for CD34+CD45RACD90+ cells with HLFhi, CRHBPhi, and CD34hi expression levels, and in HLF high clusters from b. e, Highlighting the defined HSCs on wnnUMAP. f, HSCs distributions on UMAP from two different time points. g, Top examples of HSC subpopulation-specific gene expression profiles, based on RNA modality. h-l, same analyses as a-e for donor young-2. n = 23,114 cells. Boxplot displays data from the 25th to 75th percentile, and whiskers extending to the minimum and maximum within 1.5 IQR. m, same analysis as in main Fig. 3c for donor young-2. n, Same analysis as g, for donor young-2. o-p, same analysis as in main Fig. 3e, f for donor young-2. P-values are derived from hypergeometric test.
Extended Data Fig. 8
Extended Data Fig. 8. Analysis of HSC clonal behavioral trajectories.
a, Schematic of the clonal behavioral trajectory analysis. All 78 HSC clonal groups, comprising 5,393 HSCs, are ranked based on one of the 5 behavioral measurements (see main Fig. 4) to construct the behavioral trajectories. Differential genes/peaks are identified along each of the trajectories based on Poisson regression modeling. b, Volcano plots representing the statistical analysis for identifying differential genes/peaks. c, 2,931 differential peaks are clustered based on the peak signal changes (slopes) across the 5 behavioral metrics, resulting in 5 different peak categories. d, Gene Set Enrichment Analysis for nearby genes of each peak category. e, Transcription factor DNA binding motif enrichment analysis for each peak category.
Extended Data Fig. 9
Extended Data Fig. 9. Quantification and validation of clonal structure alteration in aging hematopoiesis.
a, Identification of “expanded clades” in young and aged donors, which are defined as the clades with more than 0.5% of total cell numbers and with expansion significance lower than 0.01. b, The percentage of cells that are contributed from expanded clades are summarised for each donor. c, Related to Fig. 5d, Measuring the clonal contribution by changing the parameters that affect the definition of “clones”. The parameters involved are m (minimum number of cells as a clone, default is 50), n(minimum number of cumulative variants on the branch to cut, default is 1), p (The probability of the variant to be assigned, default is 0.6), and D (Dump small clones with less than D cells). d, Related to Fig. 5f. Single-cell fitness analysis in donor aged-2. e, Related to Fig. 5g. Cell type contributions for each expanded clade for donor aged-2. f-h, Cell-cycle gene expression analysis for expanded versus non-expanded cells. n = 9,519 and 14,715 cells for Aged-1 and Aged-2. Boxplot displays data from the 25th to 75th percentile, and whiskers extending to the minimum and maximum within 1.5 IQR. i-j, Identification of cells with loss of chromosome Y. i, The normalized number of reads on chromosome Y per cell across different donors. j, Binomial test to identify cells that significantly lose chromosome Y with fold-change <0.1 and q-value < 0.001.
Extended Data Fig. 10
Extended Data Fig. 10. ReDeeM phylogenetic analysis for extended young and aged donors.
a, Schematic of the experimental design for the extended donors (cohort-2). Bone marrow samples from 5 additional young and 3 additional aged donors were collected. Isolated bone marrow mononuclear cells and the enriched CD34+ cells were hashed and pooled for ReDeeM profiling and lineage tracing. b, The extended donor information. c, mtDNA mutation burden between extended young and aged donors across different cell types. n = 9,709 cells from extended young donors, n = 3,802 cells from extended aged donors. Boxplot displays data from the 25th to 75th percentile, and whiskers extending to the minimum and maximum within 1.5 IQR. ***indicates p-value < 2.2*10-16, derived from one-sided Wilcoxon rank sum test (d-e) Phylogenetic trees of the extended donors from d, young, and e, aged donors. Clonal groups are indicated by different colors on the outer rings. f, Shannon diversity index of the clonal composition, between extended young and aged donors. n = 5 and 3 donors g, Contribution of each clone to the total population in extended young and aged donors. (h-j) Cell type contributions in each expanded clone, corresponding to the highlighted clones in panel e. The grey area indicates the expected balanced cell type distribution.

References

    1. Liggett LA, Sankaran VG. Unraveling hematopoiesis through the lens of genomics. Cell. 2020;182:1384–1400. doi: 10.1016/j.cell.2020.08.030. - DOI - PMC - PubMed
    1. Lu R, Czechowicz A, Seita J, Jiang D, Weissman IL. Clonal-level lineage commitment pathways of hematopoietic stem cells in vivo. Proc. Natl Acad. Sci. USA. 2019;116:1447–1456. doi: 10.1073/pnas.1801480116. - DOI - PMC - PubMed
    1. Yu, V. W. C. et al. Epigenetic memory underlies cell-autonomous heterogeneous behavior of hematopoietic stem cells. Cell168, 944–945 (2017). - PMC - PubMed
    1. Sun J, et al. Clonal dynamics of native haematopoiesis. Nature. 2014;514:322–327. doi: 10.1038/nature13824. - DOI - PMC - PubMed
    1. Busch, K. et al. Fundamental properties of unperturbed haematopoiesis from stem cells in vivo. Nature518, 542–546 (2015). - PubMed