

A Versatile Intestine-on-Chip System for Deciphering the Immunopathogenesis of Inflammatory Bowel Disease
- PMID: 38253407
- PMCID: PMC11468350
- DOI: 10.1002/adhm.202302454
A Versatile Intestine-on-Chip System for Deciphering the Immunopathogenesis of Inflammatory Bowel Disease
Abstract
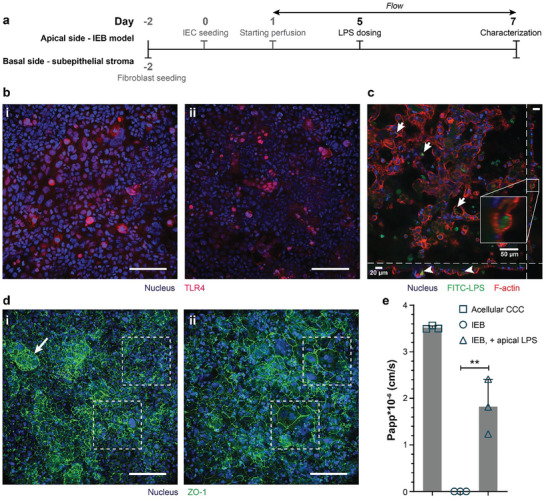
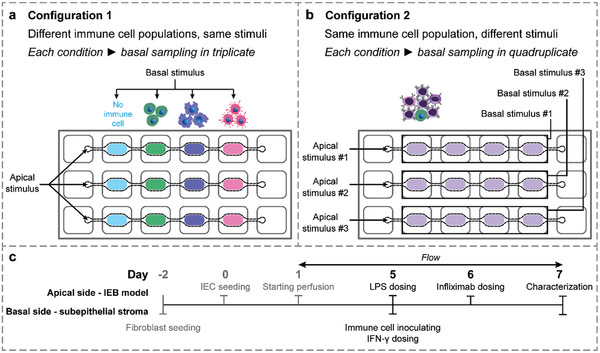
The multifactorial nature of inflammatory bowel disease (IBD) necessitates reliable and practical experimental models to elucidate its etiology and pathogenesis. To model the intestinal microenvironment at the onset of IBD in vitro, it is important to incorporate relevant cellular and noncellular components before inducing stepwise pathogenic developments. A novel intestine-on-chip system for investigating multiple aspects of IBD's immunopathogenesis is presented. The system includes an array of tight and polarized barrier models formed from intestinal epithelial cells on an in-vivo-like subepithelial matrix within one week. The dynamic remodeling of the subepithelial matrix by cells or their secretome demonstrates the physiological relevance of the on-chip barrier models. The system design enables introduction of various immune cell types and inflammatory stimuli at specific locations in the same barrier model, which facilitates investigations of the distinct roles of each cell type in intestinal inflammation development. It is showed that inflammatory behavior manifests in an upregulated expression of inflammatory markers and cytokines (TNF-α). The neutralizing effect of the anti-inflammatory antibody Infliximab on levels of TNF-α and its inducible cytokines could be explicitly shown. Overall, an innovative approach to systematically developing a microphysiological system to comprehend immune-system-mediated disorders of IBD and to identify new therapeutic strategies is presented.
Keywords: immunopathogenesis; inflammatory bowel disease; innate immunity; intestine-on-chip systems.
© 2024 The Authors. Advanced Healthcare Materials published by Wiley-VCH GmbH.
Conflict of interest statement
The authors declare no conflict of interest.
Figures


Similar articles
-
Development, validation and implementation of an in vitro model for the study of metabolic and immune function in normal and inflamed human colonic epithelium.Dan Med J. 2015 Jan;62(1):B4973. Dan Med J. 2015. PMID: 25557335 Review.
-
Monocyte and M1 Macrophage-induced Barrier Defect Contributes to Chronic Intestinal Inflammation in IBD.Inflamm Bowel Dis. 2015 Jun;21(6):1297-305. doi: 10.1097/MIB.0000000000000384. Inflamm Bowel Dis. 2015. PMID: 25901973 Free PMC article.
-
Protective effects of metformin in the pro-inflammatory cytokine induced intestinal organoids injury model.Biochem Biophys Res Commun. 2024 Jan 1;690:149291. doi: 10.1016/j.bbrc.2023.149291. Epub 2023 Nov 22. Biochem Biophys Res Commun. 2024. PMID: 38006803
-
Increase in Epithelial Permeability and Cell Metabolism by High Mobility Group Box 1, Inflammatory Cytokines and TPEN in Caco-2 Cells as a Novel Model of Inflammatory Bowel Disease.Int J Mol Sci. 2020 Nov 10;21(22):8434. doi: 10.3390/ijms21228434. Int J Mol Sci. 2020. PMID: 33182652 Free PMC article.
-
Immunopathology of inflammatory bowel disease.World J Gastroenterol. 2014 Jan 7;20(1):6-21. doi: 10.3748/wjg.v20.i1.6. World J Gastroenterol. 2014. PMID: 24415853 Free PMC article. Review.
Cited by
-
Leveraging Organ-on-Chip Models to Investigate Host-Microbiota Dynamics and Targeted Therapies for Inflammatory Bowel Disease.Adv Healthc Mater. 2025 Apr;14(10):e2402756. doi: 10.1002/adhm.202402756. Epub 2024 Nov 3. Adv Healthc Mater. 2025. PMID: 39491534 Free PMC article. Review.
-
Unraveling the Converging Roles of ASC-Dependent Inflammasomes, Interleukin-1 Superfamily Members, Serum Amyloid A, and Non-Sterile Inflammation in Disease Pathology and Fibrosis in Inflammatory Bowel Disease and Primary Sclerosing Cholangitis.Int J Mol Sci. 2025 Aug 20;26(16):8042. doi: 10.3390/ijms26168042. Int J Mol Sci. 2025. PMID: 40869366 Free PMC article. Review.
References
-
- Alatab S., Sepanlou S. G., Ikuta K., Vahedi H., Bisignano C., Safiri S., Sadeghi A., Nixon M. R., Abdoli A., Abolhassani H., Alipour V., Almadi M. A. H., Almasi‐Hashiani A., Anushiravani A., Arabloo J., Atique S., Awasthi A., Badawi A., Baig A. A. A., Bhala N., Bijani A., Biondi A., Borzì A. M., Burke K. E., Carvalho F., Daryani A., Dubey M., Eftekhari A., Fernandes E., Fernandes J. C., et al., Lancet Gastroenterol Hepatol 2020, 5, 17. - PubMed
-
- Hanauer S. B., Inflamm Bowel Dis 2006, 12, S3. - PubMed
-
- Kaplan G. G., Nat. Rev. Gastroenterol. Hepatol. 2015, 12, 720. - PubMed
-
- Sands B. E., Gastroenterology 2004, 126, 1518. - PubMed
Publication types
MeSH terms
Substances
LinkOut - more resources
Full Text Sources
