. 2024 Jan 22;15(1):668.
doi: 10.1038/s41467-024-44969-x.

Self-renewing human naïve pluripotent stem cells dedifferentiate in 3D culture and form blastoids spontaneously

Affiliations

Self-renewing human naïve pluripotent stem cells dedifferentiate in 3D culture and form blastoids spontaneously

Mingyue Guo et al. Nat Commun. .

Abstract

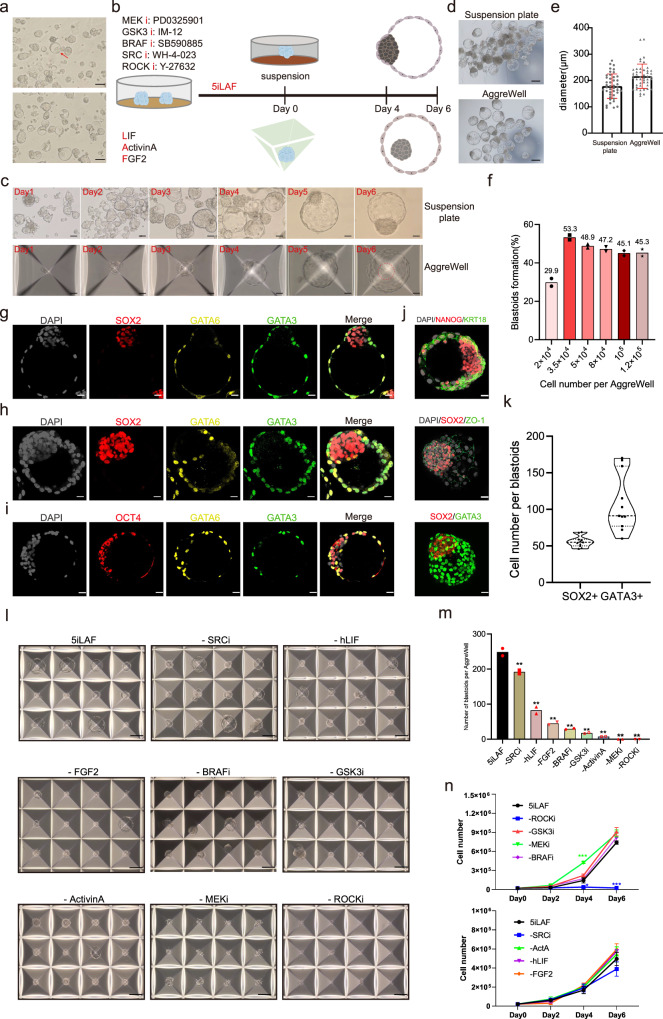
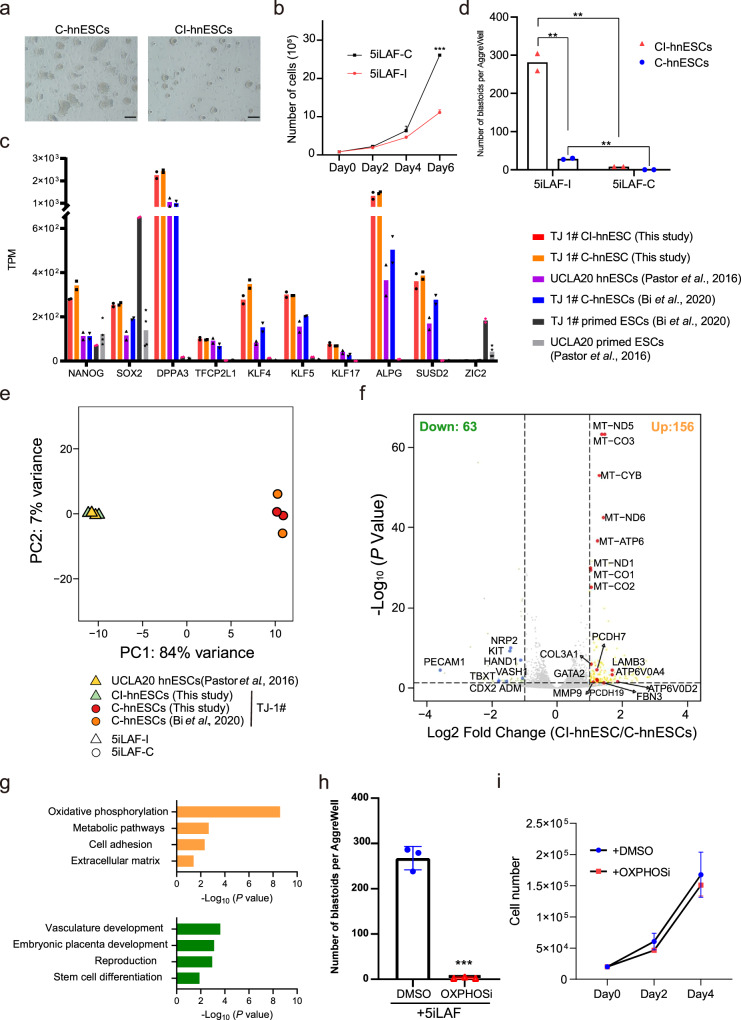
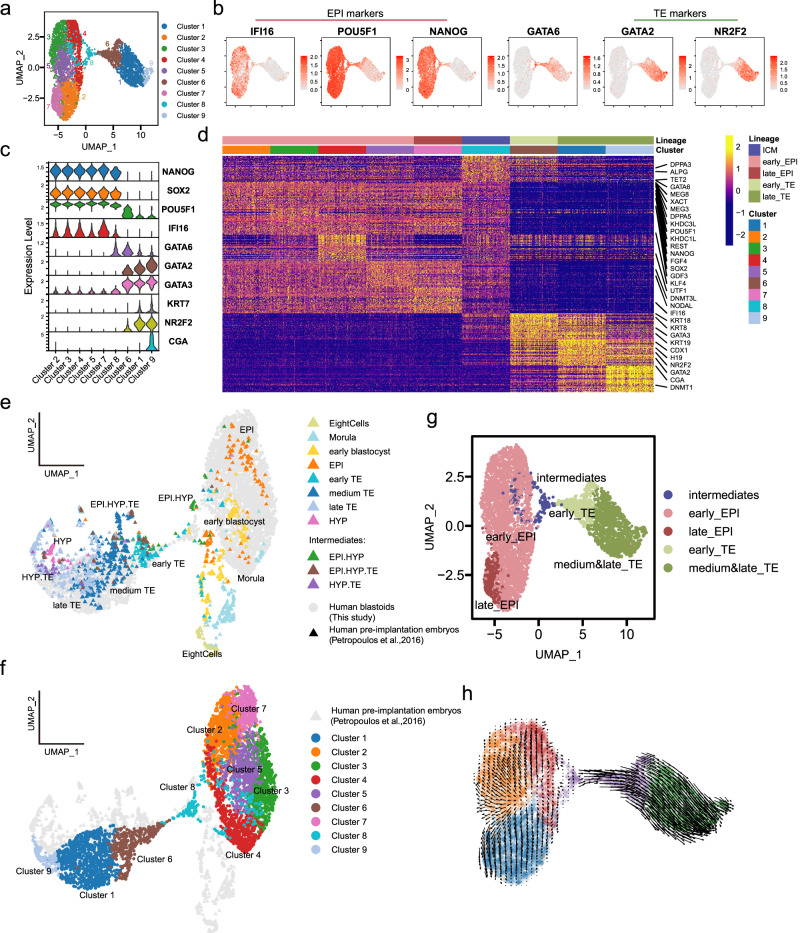
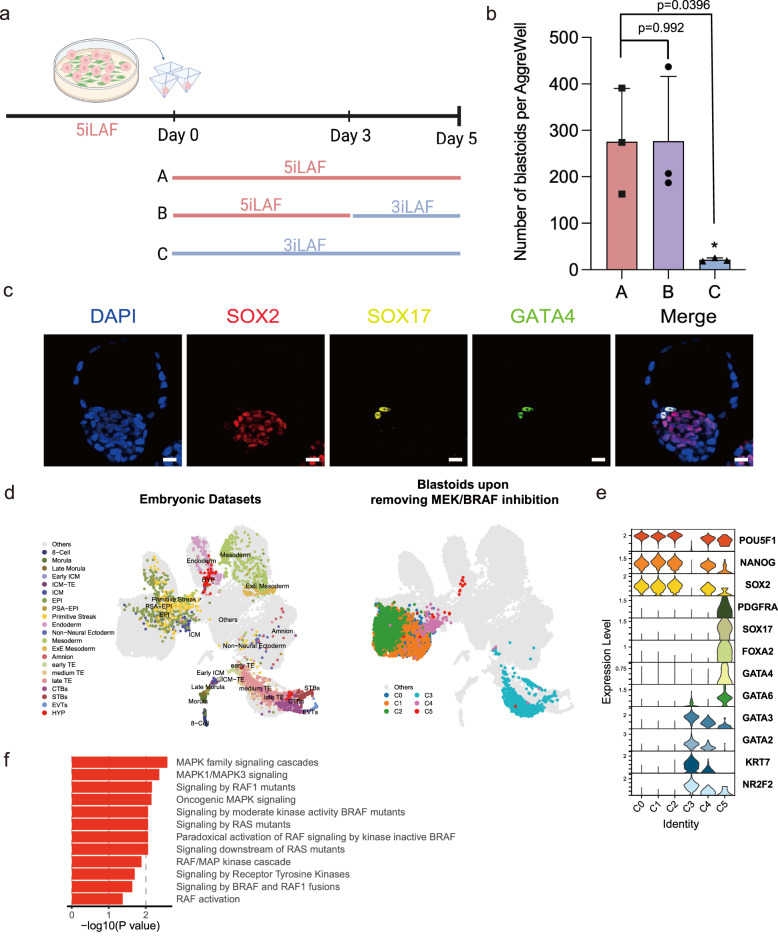
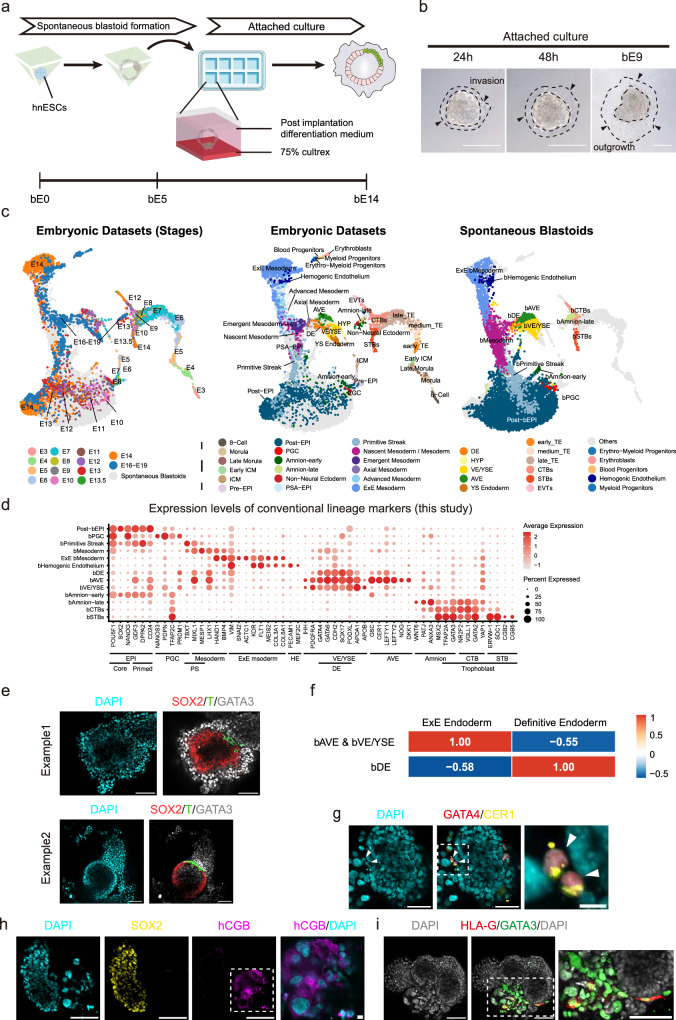
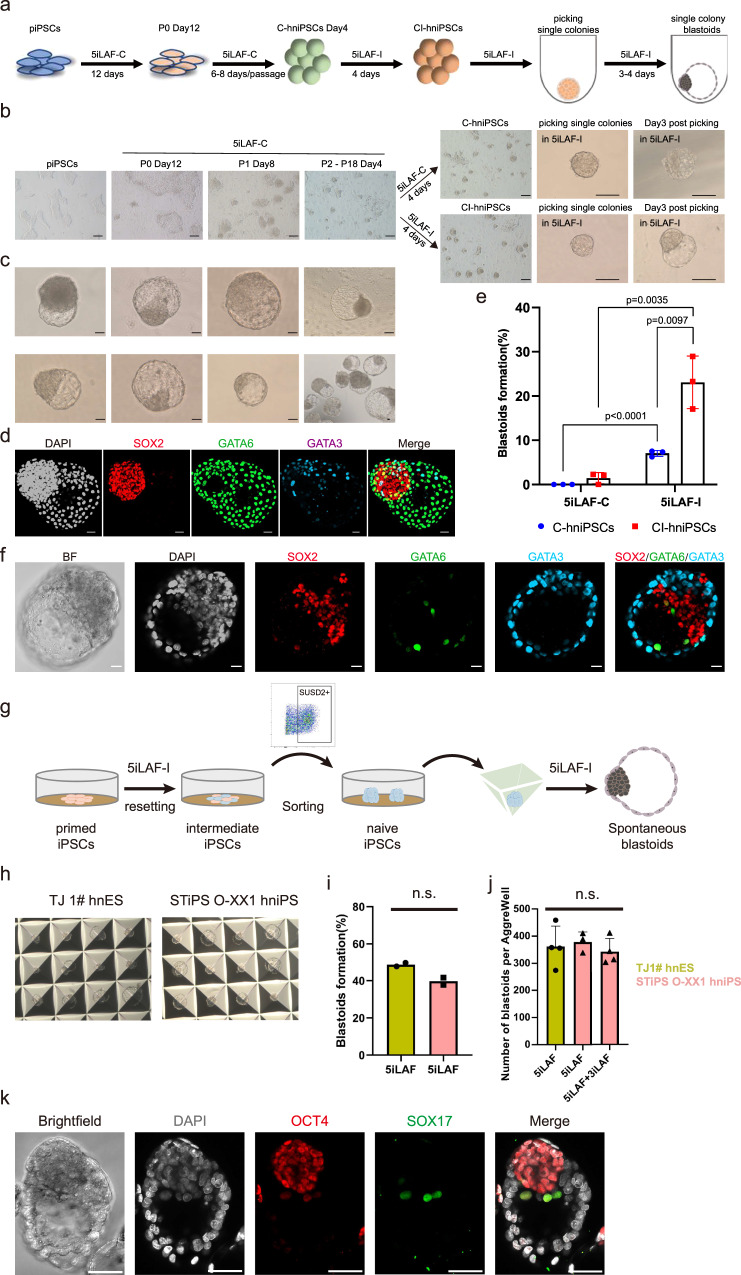
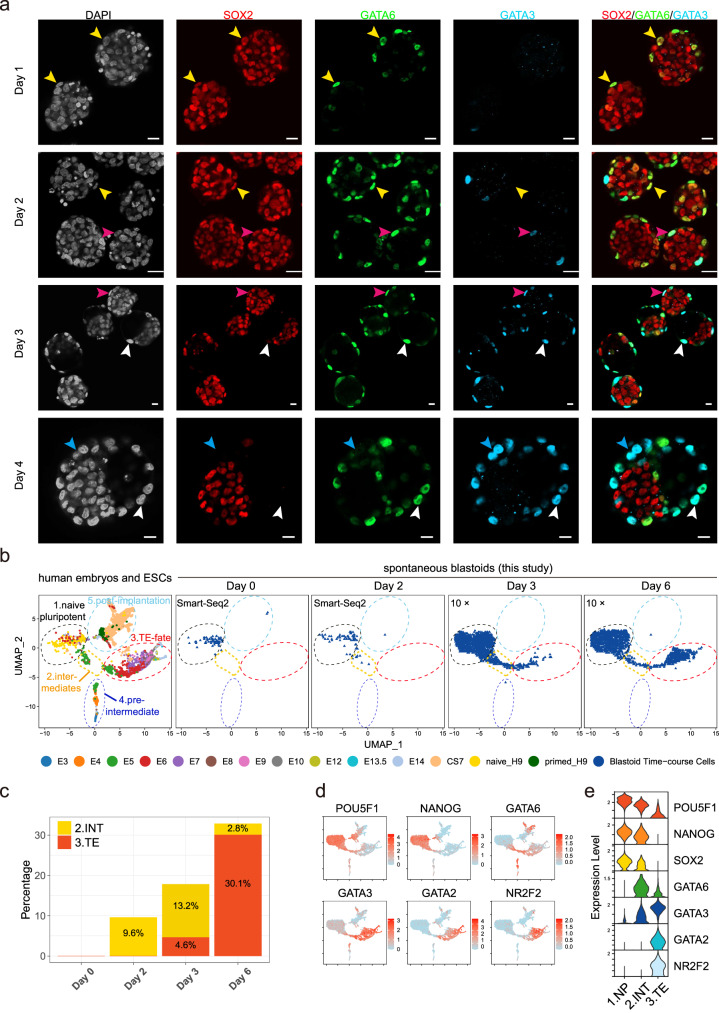
Human naïve pluripotent stem cells (hnPSCs) can generate integrated models of blastocysts termed blastoids upon switch to inductive medium. However, the underlying mechanisms remain obscure. Here we report that self-renewing hnPSCs spontaneously and efficiently give rise to blastoids upon three dimensional (3D) suspension culture. The spontaneous blastoids mimic early stage human blastocysts in terms of structure, size, and transcriptome characteristics and are capable of progressing to post-implantation stages. This property is conferred by the glycogen synthase kinase-3 (GSK3) signalling inhibitor IM-12 present in 5iLAF self-renewing medium. IM-12 upregulates oxidative phosphorylation-associated genes that underly the capacity of hnPSCs to generate blastoids spontaneously. Starting from day one of self-organization, hnPSCs at the boundary of all 3D aggregates dedifferentiate into E5 embryo-like intermediates. Intermediates co-express SOX2/OCT4 and GATA6 and by day 3 specify trophoblast fate, which coincides with cavity and blastoid formation. In summary, spontaneous blastoid formation results from 3D culture triggering dedifferentiation of hnPSCs into earlier embryo-like intermediates which are then competent to segregate blastocyst fates.


Conflict of interest statement

J.C.R.S., M.G., J.W., C.C., and K.W. submitted a patent application (202211174246.1) related to this work. Other authors declare no competing interests.

Figures

Fig. 1
Fig. 1. Self-renewing hnESCs form blastoids spontaneously.
a Representative phase-contrast images of spontaneous cysts (red arrow) in the hnESCs cultures. Scale bars, 50 μm. (n > 10). b Schematic of spontaneous blastoids formation from hnESCs in suspension plates (top) and in AggreWell (bottom) with 5iLAF medium (components are listed). Created in Adobe Illustrator. c Representative phase-contrast images of blastoids at indicated times points in suspension plates (top) and in AggreWells (bottom). Scale bars, 50 μm. (n > 10) d Representative phase-contrast images of day6-blastoids formed spontaneously in suspension plate (top) and AggreWells (bottom). Scale bars, 200 μm. e Quantification of diameter of day6-blastoids (suspension plate, n = 43(number of blastoids measured), 178.5 ± 46.5 μm; AggreWell, n = 47, 216.2 ± 46.1 μm; mean ± s.d.). f Spontaneous blastoid formation efficiency related to starting cell number per AggreWell. n = 2 (technical replicates). g–j Representative immunofluorescence staining images of blastoids formed in suspension plate (g) or in AggreWell (h–j). Scale bars, 20 μm. k Quantification of SOX2 and GATA3 cell number per blastoid. n = 11 blastoids. l and m, blastoid generation efficiency in AggreWells upon removal of single factors of 5iLAF medium. l indicates representative images and m indicates the number of blastoids generated upon removal of indicated factor. n = 2 technical replicates; mean; unpaired two-tailed t-test; **P < 0.01. Scale bars, 200 μm. n Proliferation of hnESCs cultured in 5iLAF minus each indicated factor. Two rounds independent experiments (top and bottom) with parallel control groups cultured in 5iLAF. n = 3 technical replicates; mean ± s.d.; unpaired two-tailed t-test; *P = 0.0119; ***P = 0.0003 (-MEKi); ***P = 0.00000139 (-ROCKi). Source data are provided as a Source Data file.
Fig. 2
Fig. 2. OXPHOS underlies the capacity of hnESCs to spontaneously generate blastoids.
a Representative phase-contrast images of C-hnESCs (left, cultured in 5iLAF-C, day 6) and CI-hnESCs (right, cultured in 5iLAF-I, day 6). Scale bars, 200 μm. b Proliferation of C-hnESCs cultured in 5iLAF-C (black) or 5iLAF-I (red). n = 3 replicates; mean + s.d.; unpaired two-tailed t-test. ***p = 0.00000416. c TPM (Transcripts Per Kilobase Million) expression level of representative naïve markers and primed marker ZIC2 among cell lines. n = 2 biological replicates (n = 4 for UCLA20 primed ESCs). d Number of blastoids generated from CI-hnESCs and C-hnESCs with 5iLAF-I or 5iLAF-C medium in AggreWell. n = 2 technical replicates; mean; unpaired two-tailed t-test; **P < 0.01. e Principal component analysis (PCA) of bulk RNA-seq datasets from CI-hnESCs, C-hnESCs and published studies. f Volcano plots of differential expressed genes identified using two-sided Wilcoxon Rank Sum Test with Bonferroni correction (|Log2 Fold Change | >1 and FDR < 0.05, upregulated genes in yellow and red, downregulated genes in green and blue) in CI-hnESCs comparing to C-hnESCs. g Bar plot showing the −log10 (P value) of the gene ontology terms enriched in upregulated genes (top) or downregulated genes (bottom). The input genes were selected as was descripted in f and the P values shown were computed with modified one-sided Fisher’s Exact test using David functional annotation tool. h Quantification of blastoids number in 5iLAF-I with dimethyl sulfoxide (DMSO) or OXPHOS inhibitor (IACS-010759, 5 μM). n = 3 technical replicates; mean ± s.d.; unpaired two-tailed t-test; ***p = 0.0000607. i CI-hnESC proliferation in 5iLAF-I with DMSO or OXPHOS inhibitor. n = 3 replicates; mean ± s.d.; Source data are provided as a Source Data file.
Fig. 3
Fig. 3. Spontaneous blastoids resemble early human blastocysts.
a Uniform manifold approximation and projection (UMAP) embedding of single-cell transcriptomes from day6-blastoids generated in AggreWell. b Expression of human EPI markers IFI16, POU5F1 and NANOG and TE markers GATA2 and NR2F2. c Expression level of blastocyst lineage markers in each cluster. d Heat map showing the expression levels of the top 50 genes that are enriched in each cluster. Expression levels: z-scores. e, f UMAP of single-cell transcriptomes of cells from day6-blastoids (f) integrated with published datasets from human early embryos (e). g Rename the clusters (defined in a on the basis of similarities to human blastocyst lineages). h RNA velocity analysis indicating the cell trajectories shown in arrows.
Fig. 4
Fig. 4. Spontaneous blastoids specify hypoblast fate upon removal of BRAF/MEK signaling inhibition.
a Schematic of HYP-like cell fate induction by removing BRAF/MEK inhibitors. Created with BioRender.com. Strategies were indicated as follows: A, Spontaneous blastoids were formed by culturing in 5iLAF for 5 days; B, Spontaneous blastoids were formed by culturing in 5iLAF for 3 days first and then switched to 3iLAF (5iLAF-BRAFi-MEKi) for 2 days; C, Spontaneous blastoids were formed by culturing in 3iLAF for 5 days. b Spontaneous blastoid generation efficiency for the indicated conditions in a. n = 3 biological replicates; mean ± s.d.; Ordinary one-way ANOVA with Tukey’s multiple comparisons test; * means p < 0.05. c Representative immunofluorescence staining images of spontaneous blastoids containing HYP-like cells. Scale bars, 20 μm. d Comparison of embryonic datasets (left) with the spontaneous blastoids (right) after removing BRAF/MEK inhibitors from day 3 evidenced the HYP fate specification. PSA-EPI, primitive streak anlage stage epiblast. ExE extraembryonic, CTB cytotrophoblasts, STB syncytiotrophoblasts, EVT extravillous cytotrophoblasts. e Expression levels of blastocyst lineage markers for each cluster. f Enriched gene ontology (GO) terms in the differentially expressed genes of C5 compared against C0-3 identified using two-sided Wilcoxon Rank Sum Test with Bonferroni correction (Log2 Fold Change >0 and FDR < 0.05). The P values shown were computed with modified one-sided Fisher’s Exact test using David functional annotation tool. Source data are provided as a Source Data file.
Fig. 5
Fig. 5. Spontaneous blastoids have post-implantation developmental potential.
a Schematic of attached culture of spontaneous blastoids for post-implantation development. Created in Adobe Illustrator. b Representative images showing rapid invasion and outgrowth of blastoid trophoblasts. (n > 10). c Comparison of embryonic datasets (left and middle) with the differentiated spontaneous blastoids on bE14 (right). d Gene expression patterns of conventional lineage markers in clusters shown in Fig. 5a. Dot size represents the percentage of cells that express the indicated gene and color intensity represents the expression levels. e Representative immunofluorescent images showing two examples of T+ primitive streak like structures in bE14 blastoids. f Gene set variance analysis (GSVA) comparing similarities of clusters bAVE, bVE/YSE and bDE to natural embryo ExE endoderm and definitive endoderm. Higher values represent closer similarity. g Representative immunofluorescent images of bAVE-like cells showing GATA4 expression in the nucleus and secreted CER1 proteins in the extracellular region. (n = 2 from 2 individual experiments). h Representative immunofluorescent images of bSTBs showing hCGB expression. (n = 2 from 2 individual experiments) i, Representative immunofluorescent images of EVT precurosrs showing co-expression of HLA-G and GATA3 (n = 2 from 2 individual experiments). All scale bars, 100 μm.
Fig. 6
Fig. 6. Spontaneous blastoid generation in independent hnPSC lines.
a Schematics of generation of spontaneous individual colony blastoids from iPSCs with GSK3 inhibitor switch strategy. Created in Adobe Illustrator. b Representative phase-contrast images of cell, colonies or blastoids during the conversion from piPSCs to hniPSCs, the switch of GSK3 inhibitors and the generation of individual colony blastoids. Scale bars, 200 μm. c Representative phase-contrast images of spontaneous blastoids generated from CI-hniPSCs in b. Scale bars, 50 μm. d Representative immunofluorescence staining images of blastoids in c. Scale bars, 50 μm. e Quantification of formation efficiency of individual colony blastoids generated from C-hniPSCs and CI-hniPSCs with 5iLAF-I or 5iLAF-C medium in AggreWell. n = 3 technical replicates; mean ± s.d.; unpaired two-tailed t-test; **P < 0.01, ***P < 0.001. f Representative immunofluorescence staining images of blastoids generated from dissociated hniPSCs in AggreWell (Supplementary Fig. 5e). BF, bright field. Scale bars, 20 μm. g Schematics of spontaneous blastoid formation from hniPSCs converted from primed iPSCs using exclusively 5iLAF-I medium and without manual colony picking. Created in Adobe Illustrator. h Representative phase-contrast images of blastoids in AggreWell parallelly generated via method from Fig. 1a and  6g. i Spontaneous blastoid formation efficiency related to cell line per AggreWell. n = 2 (technical replicates); ordinary one-way ANOVA. j Quantitative scoring of number of spontaneous blastoids per AggreWell of independent cell lines that were also generated using different methods, n = 4 (technical replicates); mean ± s.d; ordinary one-way ANOVA with Tukey’s multiple comparisons test. k Representative immunofluorescent images of blastoid from hniPSCs in which BRAF/MEK inhibition was removed for 2 days after 3 days in 5iLAF medium. Please note HYP-like SOX17+ cells lining between EPI-like cells and cavity. Scale bars, 100 μm. Source data are provided as a Source Data file.
Fig. 7
Fig. 7. Dynamics of cell fate specification during spontaneous blastoids formation.
a Representative time-course immunofluorescence staining images of day 1–4 aggregates/blastoids in AggreWell. Yellow arrows: SOX2+GATA6+GATA3 cells; White arrows: SOX2GATA6+GATA3+ cells; Pink arrows: SOX2+GATA6+GATA3+ cells; Blue arrows: SOX2GATA6GATA3+ cells; Scale bars, 20 μm. (n > 10). b Joint UMAP analysis and re-cluster of published human embyros/ESCs data (left) and day 0, 2, 3 and 6 spontaneous blastoid scRNA-seq data (right). c Contribution of cluster 2 and 3 to day 0, 2, 3 and 6 blastoid cells. d, e Expression levels of marker genes in cells and clusters. Source data are provided as a Source Data file.

References

    1. Yan L, et al. Single-cell RNA-Seq profiling of human preimplantation embryos and embryonic stem cells. Nat. Struct. Mol. Biol. 2013;20:1131–1139. doi: 10.1038/nsmb.2660. - DOI - PubMed
    1. Blakeley P, et al. Defining the three cell lineages of the human blastocyst by single-cell RNA-seq. Development. 2015;142:3151–3165. doi: 10.1242/dev.131235. - DOI - PMC - PubMed
    1. Petropoulos S, et al. Single-Cell RNA-Seq Reveals Lineage and X Chromosome Dynamics in Human Preimplantation Embryos. Cell. 2016;165:1012–1026. doi: 10.1016/j.cell.2016.03.023. - DOI - PMC - PubMed
    1. Meistermann D, et al. Integrated pseudotime analysis of human pre-implantation embryo single-cell transcriptomes reveals the dynamics of lineage specification. Cell Stem Cell. 2021;28:1625–1640.e1626. doi: 10.1016/j.stem.2021.04.027. - DOI - PubMed
    1. Radley A, et al. Entropy sorting of single-cell RNA sequencing data reveals the inner cell mass in the human pre-implantation embryo. Stem Cell Rep. 2023;18:47–63. doi: 10.1016/j.stemcr.2022.09.007. - DOI - PMC - PubMed

Substances