. 2024 Jan 22;15(1):669.
doi: 10.1038/s41467-024-44860-9.

LOX-1 acts as an N6-methyladenosine-regulated receptor for Helicobacter pylori by binding to the bacterial catalase

Affiliations

LOX-1 acts as an N6-methyladenosine-regulated receptor for Helicobacter pylori by binding to the bacterial catalase

Judeng Zeng et al. Nat Commun. .

Abstract

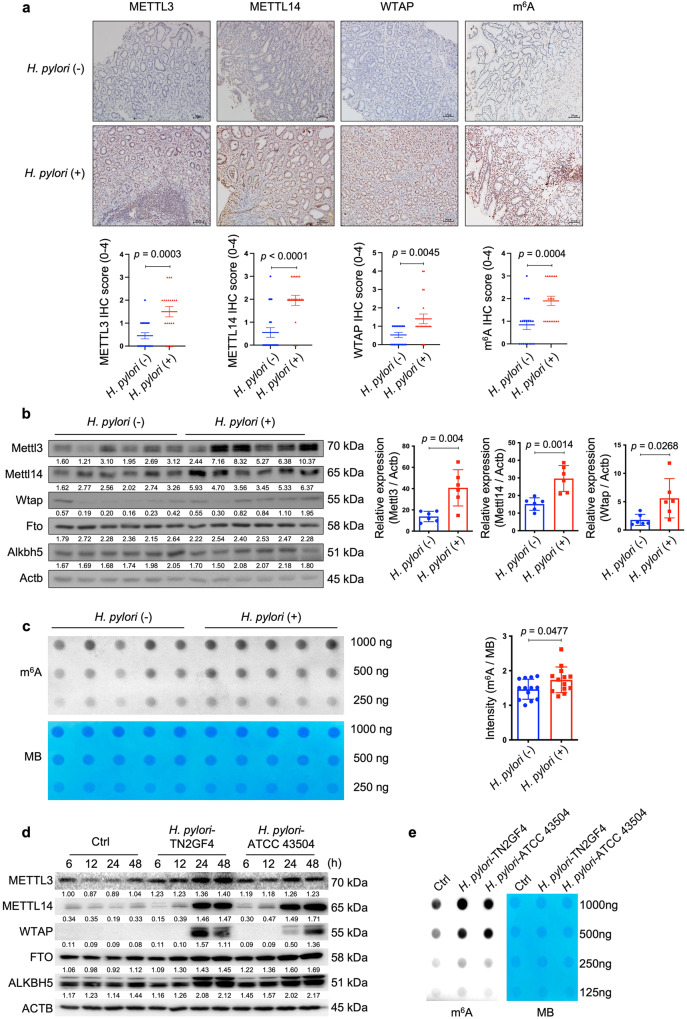
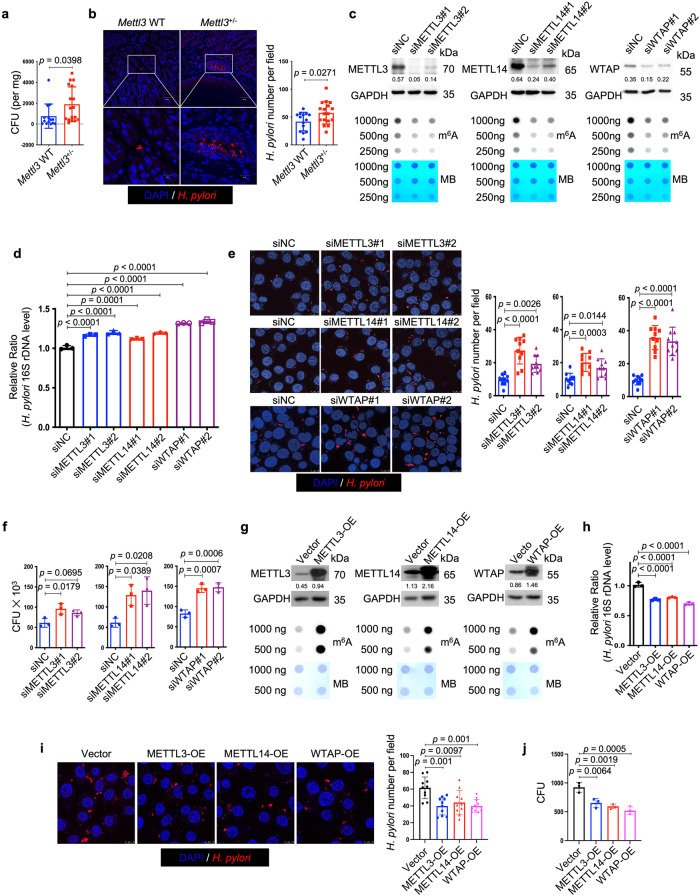
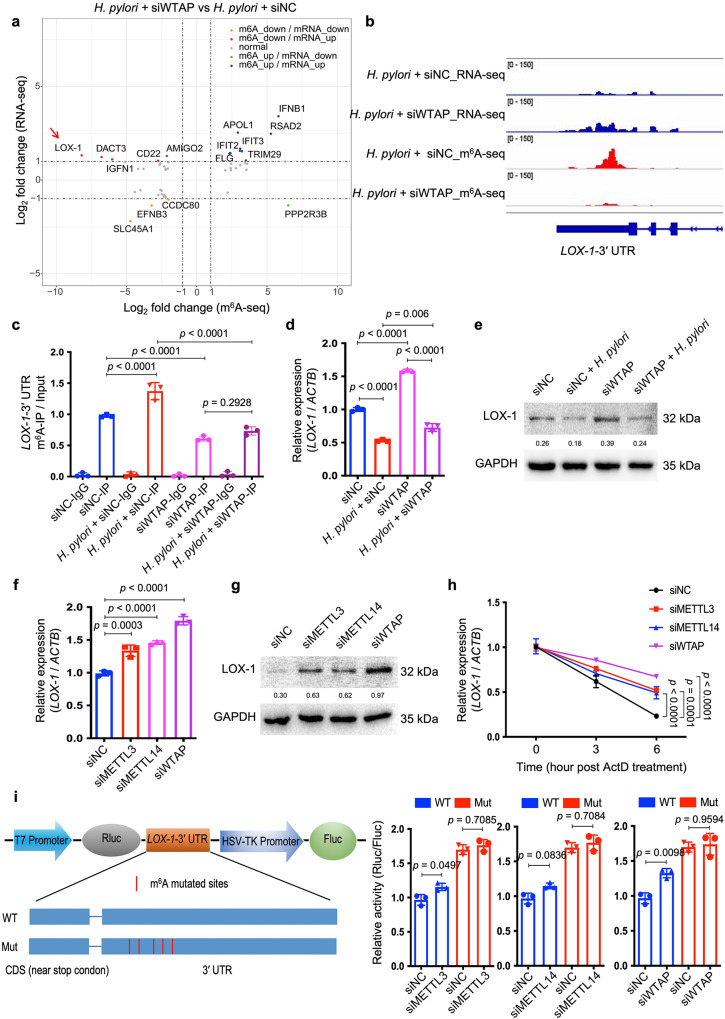
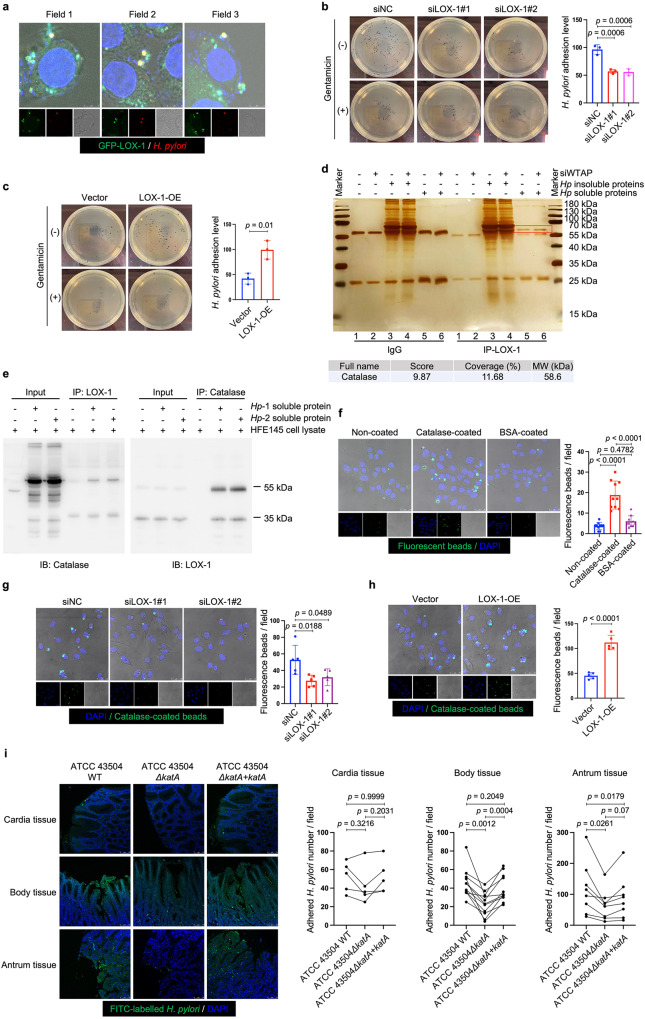
The role of N6-methyladenosine (m6A) modification of host mRNA during bacterial infection is unclear. Here, we show that Helicobacter pylori infection upregulates host m6A methylases and increases m6A levels in gastric epithelial cells. Reducing m6A methylase activity via hemizygotic deletion of methylase-encoding gene Mettl3 in mice, or via small interfering RNAs targeting m6A methylases, enhances H. pylori colonization. We identify LOX-1 mRNA as a key m6A-regulated target during H. pylori infection. m6A modification destabilizes LOX-1 mRNA and reduces LOX-1 protein levels. LOX-1 acts as a membrane receptor for H. pylori catalase and contributes to bacterial adhesion. Pharmacological inhibition of LOX-1, or genetic ablation of Lox-1, reduces H. pylori colonization. Moreover, deletion of the bacterial catalase gene decreases adhesion of H. pylori to human gastric sections. Our results indicate that m6A modification of host LOX-1 mRNA contributes to protection against H. pylori infection by downregulating LOX-1 and thus reducing H. pylori adhesion.


Conflict of interest statement

The authors declare no competing interests.

Figures

Fig. 1
Fig. 1. H. pylori infection up-regulated the expression levels of METTL3, METTL14, WTAP and increased cellular m6A levels in vivo and in vitro.
a Representative images of immunohistochemical (IHC) staining for METTL3, METTL14, WTAP and cellular m6A levels in H. pylori-positive (n = 20 samples) and -negative (n = 20 samples) human gastric specimens. Quantitative analysis was shown as means ± SD. Scale bar, 20 μm. b Total proteins were extracted from mouse stomach tissues of the control group (n = 6 animals) and H. pylori-infected group (n = 6 animals), and the expression levels of Mettl3, Mettl14, Wtap, Fto and Alknh5 were examined by Western blots. Actb was used as a loading control. The gray scales of each sample were measured by Image J and the quantitative analysis of target/Actb was conducted. Quantitative analysis was shown as means ± SD. c The m6A level of poly(A)+ RNAs in mouse stomach specimens with (n = 5 animals) or without (n = 5 animals) H. pylori colonization was evaluated by m6A dot blot assay. The RNA from each sample was loaded equally by a 2-fold serial dilution. MB staining was used as a loading control. The intensity of dots was measured by Image J and quantitative analysis was shown as m6A/MB (n = 13 per group in total; in addition to the 5 samples per group shown in this figure, 8 extra samples per group were shown in Supplementary Fig. 2). Quantitative analysis was shown as means ± SD. d Human gastric epithelial cells HFE145 were co-cultured with two H. pylori strains (TN2GF4, ATCC 43504; MOI = 100). The cells were harvested at different time points (6, 12, 24, 48 h) to measure the protein levels of m6A “writers” (METTL3, METTL14, WTAP) and “erasers” (FTO, ALKBH5) by Western blots. ACTB was used as a loading control. The blots shown are representative of three independent experiments with similar results. e HFE145 cells were co-cultured with two H. pylori strains (TN2GF4, ATCC 43504; MOI = 100) for 24 h. Poly(A)+ RNA from total RNA was isolated form H. pylori-infected HFE145 cells. The Poly(A)+ RNA was loaded onto the membrane with a 2-fold serial dilution. MB staining was used as a loading control. The blots shown are representative of three independent experiments with similar results. Statistical analysis of the data (ac) was performed using unpaired two-tailed Student’s t test and the corresponding p-values are included in the figure panels. Source data are provided as a Source Data file.
Fig. 2
Fig. 2. Ablation of m6A writers enhanced whereas overexpression of m6A writers reduced H. pylori infection.
a, b Wild type (n = 14 animals) and Mettl3+/− mice (n = 17 animals) were infected with H. pylori strain SS1 for 3 months. a Mouse stomach tissues were harvested and weighted, and then homogenized in sterile PBS. The samples were further diluted and spread on H. pylori-selective blood agar plates. After growing for 5 days, the colony numbers were count for quantitative analysis. b Parafilm-embedded sections of mouse stomach were stained to visualize H. pylori (Red) and the nuclei (Blue). Ten visual fields of each sample were randomly selected to count H. pylori number. Scale bar, 50 μm. c, g Two individual siRNAs or overexpression plasmids were transfected into HFE145 cells to knock down or overexpress METTL3, METTL14 and WTAP, respectively. The knockdown or overexpression efficiency was examined by Western blots. GAPDH served as a loading control. The m6A level of poly(A)+ RNA was examined by Dot blot. Methylene blue (MB) staining was used as a loading control. d–f, h–j HFE145 cells transfected with siRNAs or overexpression plasmids were infected with H. pylori (MOI = 100) for 24 h. d, h Intracellular H. pylori 16S ribosomal DNA levels were measured by real-time PCR. Human GAPDH was used as an internal control (n = 3 replicates for each group). e, i Cells were stained to visualize invaded H. pylori (Red) and the nuclei (Blue). Ten visual fields of each group were randomly selected to count H. pylori number. f, j Cells were permeabilized with 1% saponin for 15 min. The diluted samples were then spread on H. pylori-selective blood agar plates and incubated for 5 days to count the colony number (n = 3 replicates for each group). All the quantitative data were shown as means ± SD. Statistical analysis of the data was performed using unpaired two-tailed Student’s t test (a, b) or one-way ANOVA (df, h, i, j) followed by Tukey’s multiple comparison tests with adjustments, and the corresponding p-values are included in the figure panels. The statistical significance of the data (df, h, i, j) was calculated from one of three independent experiments with similar results. Source data are provided as a Source Data file.
Fig. 3
Fig. 3. LOX-1 was identified as a m6A-modified gene upon H. pylori infection.
a Integrated analysis of m6A-seq and RNA-seq from H. pylori-infected HFE145 cells transfected with negative control or WTAP siRNAs was shown. The fold change of m6A-seq was normalized to the corresponding transcript expression level. Genes with Log2 fold change > 1 were highlighted. b The m6A peaks located at 3′UTR of LOX-1 in m6A-seq and the corresponding peaks in RNA-seq were visualized by IGV tool. ce HFE145 cells transfected with negative control or WTAP siRNAs were infected with or without H. pylori for 24 h. c MeRIP-quantitative PCR was performed to validate m6A enrichment on LOX-1-3′UTR. The m6A enrichment of each group was calculated by m6A-IP/input (n = 3 replicates for each group). d LOX-1 mRNA levels of each group were measured by real-time PCR. Human ACTB was used as an internal control (n = 3 replicates for each group). e LOX-1 protein levels of each group were examined by Western blots. Human GAPDH was used as a loading control. fh HFE145 cells transfected with negative control or siRNAs targeting METTL3/METTL14/WTAP were infected with H. pylori for 24 h. f LOX-1 mRNA levels of each group were measured by real-time PCR. Human ACTB was used as an internal control (n = 3 replicates for each group). g LOX-1 protein levels of each group were examined by Western blots. Human GAPDH was used as a loading control. h RNA decay rates of LOX-1 of each group were measured after treating with Actinomycin D (normalize to 0 h, n = 3 replicates for each group). i Two luciferase plasmids were constructed by inserting corresponding CDS into pmiR-RB-ReportTM vector. The wild type plasmid contained the full-length 3′UTR of LOX-1 and partial CDS near the stop codon, whereas five m6A-consensus motifs identified from m6A-seq were mutated with A-to-C conversion in the mutated plasmid. The relative luciferase activity was measured and calculated by normalizing Renilla to Firefly activity (n = 3 replicates for each group). All the quantitative data were shown as means ± SD. Statistical analysis of the data was performed using one-way ANOVA (c, d, f, h, i) followed by Tukey’s multiple comparison tests with adjustments and the corresponding p-values are included in the figure panels. The statistical significance of the data (c, d, f, h, i) was calculated from one of three independent experiments with similar results. Source data are provided as a Source Data file.
Fig. 4
Fig. 4. LOX-1 regulated intracellular H. pylori survival in gastric epithelial cells.
a, e Two individual siRNAs or overexpression plasmids were transfected into HFE145 cells to knock down or overexpress LOX-1. The knockdown or overexpression efficiency was validated by Western blots. GAPDH was served as a loading control. bd, fh HFE145 cells transfected with siRNAs or overexpression vector of LOX-1 were infected with H. pylori (MOI = 100) for 24 h. b, f Intracellular H. pylori 16S ribosome DNA levels were measured by real-time PCR. Human GAPDH was used as an internal control (n = 3 replicates for each group). c, g Cells were stained to visualize invaded H. pylori (Red) and nuclei (Blue). Ten visual fields of each group were randomly selected to count H. pylori number. d, h Cells were permeabilized with 1% saponin for 15 min. The diluted samples were then spread on H. pylori-selective blood agar plates and incubated for 5 days to count the colony number (n = 3 replicates for each group). i HFE145 cells transfected with WTAP siRNAs and/or LOX-1 siRNAs were infected with H. pylori (MOI = 100) for 24 h. Intracellular H. pylori 16S ribosomal DNA levels were measured by real-time PCR. Human GAPDH was used as an internal control (n = 3 replicates for each group). j, k Wild type (n = 20 animals) and Lox-1−/− mice (n = 18 animals) were infected with H. pylori strain SS1 for 1 month. j Mouse stomach tissues were harvested and weighted, and then homogenized in sterile PBS. The samples were further diluted and spread on H. pylori-selective blood agar plates. After growing for 5 days, the colony numbers were count for quantitative analysis. k Parafilm-embedded sections of mouse stomach were stained to visualize Lox-1 (green), H. pylori (Red) and the nuclei (Blue). Ten visual fields of each sample were randomly selected to count H. pylori number and measure the colocalized signals of H. pylori and Lox-1. Scale bar, 10 μm. All the quantitative data were shown as means ± SD. Statistical analysis of the data was performed using unpaired two-tailed Student’s t test (f, g, h, j, k) or one-way ANOVA (bd, i) followed by Tukey’s multiple comparison tests with adjustments, and the corresponding p-values are included in the figure panels. The statistical significance of the data (bd, f, gi) was calculated from one of three independent experiments with similar results. Source data are provided as a Source Data file.
Fig. 5
Fig. 5. LOX-1 was a cell surface protein mediating H. pylori adhesion.
a HFE145 cells expressing GFP-LOX-1 (green) protein were infected with H. pylori (MOI = 100) for 6 h, and cells were further stained to visualize H. pylori (red). The representative visual fields shown are representative of three independent experiments with similar results. Scale bar, 5 μm. b, c HFE145 cells transfected with siRNAs or overexpression plasmid of LOX-1 were infected with H. pylori (MOI = 100) for 6 h, followed by treating with or without 200 μg/ml gentamycin for 2 h. Cells were permeabilized with 1% saponin for 15 min. The diluted samples were then spread on H. pylori-selective blood agar plates and incubated for 5 days to count the colony number. H. pylori adhesion levels were calculated by subtracting the CFU of group with gentamycin treatment from the CFU of the group without (n = 3 replicates for each group). d The lysates of HFE145 cells transfected with negative control or WTAP siRNAs were incubated with soluble or insoluble proteins of H. pylori. A specific antibody was used to pull down LOX-1 and its interacting proteins from the incubated protein mixture. The pulled down proteins were separated in SDS-PAGE followed by silver staining. The red square indicates a protein band that was only observed in the LOX-1-pulled down groups incubated with H. pylori soluble proteins. Mass spectrum analysis revealed the specific protein band as H. pylori catalase. The gel shown is representative of three independent experiments with similar results. e HFE145 cell lysate was incubated with the soluble proteins of two H. pylori strains (TN2GF4 and ATCC 43504), and LOX-1 or catalase antibody was used to perform reciprocal co-immunoprecipitation assay. The predicted molecular size of catalase is 60 kDa, and the molecular size of LOX-1 is 50 kDa (mature form) and 32 kDa (precursor). The blots shown are representative of three independent experiments with similar results. f HFE145 cells were incubated with non-coated, catalase-coated, or BSA-coated fluorescent beads (green) for 6 h (MOI = 100), and cells were stained to visualize nuclei (blue). Ten visual fields of each group were randomly selected to count the attached and internalized fluorescent beads. g, h HFE145 cells transfected with siRNAs or overexpression vector of LOX-1 were incubated with catalase-coated fluorescent beads (MOI 100) for 6 h and were stained to visualize nuclei (blue). Ten visual fields of each group were randomly selected to count the attached and internalized fluorescent beads. Scale bar, 25 μm. i FITC-labeled H. pylori strains (wild-type, ΔkatA and ΔkatA + katA strains) were respectively incubated with human normal stomach tissue array (72 tissue cores from 24 cases (i.e., triplicate sections for each case), US Biomax, BN01011B). Each line represents the binding of the three H. pylori strains in an individual patient as measured by calculating the mean number of adhered H. pylori on triplicate sections, respectively. Quantitative analysis of the bacteria binding to different gastric areas (cardia tissues from 5 cases, gastric body tissues from 11 cases, and gastric antrum tissues from 8 cases) were performed, respectively. Scale bar, 75 μm. All the quantitative data were shown as means ± SD. Statistical analysis of the data was performed using unpaired two-tailed Student’s t test (c, h) or one-way ANOVA (b, f, g, i) followed by Tukey’s multiple comparison tests with adjustments, and the corresponding p-values are included in the figure panels. The statistical significance of the data (bd, fh) was calculated from one of three independent experiments with similar results. Source data are provided as a Source Data file.
Fig. 6
Fig. 6. Administration of BI-0115, a LOX-1 inhibitor, suppressed H. pylori infection in vitro and in vivo.
ad HFE145 cells pre-treated with LOX-1 inhibitor (BI-0115, 2.5 μM) or control chemical analog (BI-1580, 2.5 μM) were infected with H. pylori (MOI = 100) for 6 h. a Intracellular H. pylori 16 S ribosomal DNA levels were measured by real-time PCR. Human GAPDH was used as an internal control (n = 3 replicates for each group). b Cells were stained to visualize invaded H. pylori (Red) and nuclei (Blue). Ten visual fields of each group were randomly selected to count the H. pylori number. Scale bar, 10 μm. c Cells were permeabilized with 1% saponin for 15 min. The diluted samples were then spread on H. pylori-selective blood agar plates and incubated for 5 days to count colony number (n = 3 replicates for each group). d Cells were treated with or without 200 μg/ml gentamycin for 2 h, and permeabilized with 1% saponin for 15 min. The diluted samples were then spread on H. pylori-selective blood agar plates and incubated for 5 days to count the colony number. H. pylori adhesion levels were calculated by subtracting the CFU of the group with gentamycin treatment from the CFU of the group without (n = 3 replicates for each group). e C57BL/6J mice were orally inoculated with H. pylori strain SS1 for 3 months, followed by administration of the vehicle (n = 10 animals) or the LOX-1 inhibitor (BI-0115; 10 mg/kg, n = 10 animals) on alternate days for 2 weeks. f Mouse stomach tissues were harvested and weighted, and then homogenized in sterile PBS. The samples were further diluted and spread on H. pylori-selective blood agar plates. After growing for 5 days, the colony numbers were count for quantitative analysis (n = 10 animals for each group). g Parafilm-embedded sections of mouse stomach were stained to visualize colonized H. pylori (Red) and the nuclei (Blue). Ten visual fields of each sample were randomly selected to count H. pylori number. Scale bar, 25 μm. h Parafilm-embedded sections were stained with hematoxylin and eosin (H&E). Histopathological assessment (cellular infiltration: 0–3) was conducted in two separate tissue sections for each animal (n = 10 animals for each group). Scale bar, 100 μm. i mRNA expressions of pro-inflammatory cytokines (Il1b, Il6, Tnf) in mouse stomach were measured by real-time PCR (n = 10 animals for each group). All the quantitative data were shown as means ± SD. Statistical analysis of the data was performed using unpaired two-tailed Student’s t test (fi) or one-way ANOVA (ad) followed by Tukey’s multiple comparison tests with adjustments, and the corresponding p-values are included in the figure panels. The statistical significance of the data (a, c, d, f, h, i) was calculated from one of three independent experiments with similar results. Source data are provided as a Source Data file.

References

    1. Crowe SE. Helicobacter pylori infection. N. Engl. J. Med. 2019;380:1158–1165. doi: 10.1056/NEJMcp1710945. - DOI - PubMed
    1. Tshibangu-Kabamba E, Yamaoka Y. Helicobacter pylori infection and antibiotic resistance—from biology to clinical implications. Nat. Rev. Gastroenterol. Hepatol. 2021;18:613–629. doi: 10.1038/s41575-021-00449-x. - DOI - PubMed
    1. Valenzuela MA, Canales J, Corvalan AH, Quest AF. Helicobacter pylori-induced inflammation and epigenetic changes during gastric carcinogenesis. World J. Gastroenterol. 2015;21:12742–12756. doi: 10.3748/wjg.v21.i45.12742. - DOI - PMC - PubMed
    1. Kusters JG, van Vliet AH, Kuipers EJ. Pathogenesis of Helicobacter pylori infection. Clin. Microbiol. Rev. 2006;19:449–490. doi: 10.1128/CMR.00054-05. - DOI - PMC - PubMed
    1. Sugano K, et al. Kyoto global consensus report on Helicobacter pylori gastritis. Gut. 2015;64:1353–1367. doi: 10.1136/gutjnl-2015-309252. - DOI - PMC - PubMed