

Viable tumor cell density after neoadjuvant chemotherapy assessed using deep learning model reflects the prognosis of osteosarcoma
- PMID: 38253709
- PMCID: PMC10803362
- DOI: 10.1038/s41698-024-00515-y
Viable tumor cell density after neoadjuvant chemotherapy assessed using deep learning model reflects the prognosis of osteosarcoma
Abstract
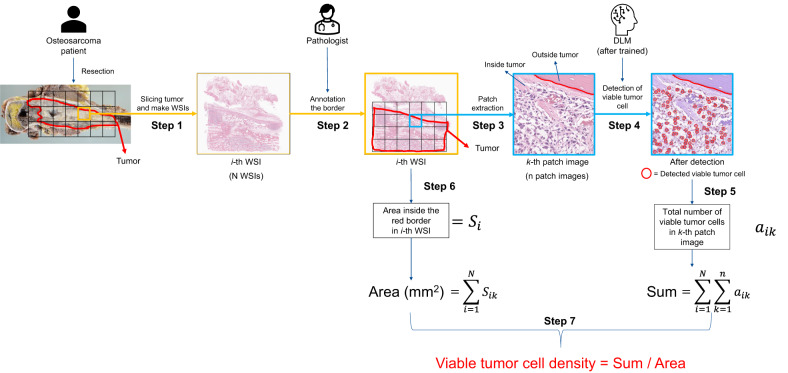
Prognosis after neoadjuvant chemotherapy (NAC) for osteosarcoma is generally predicted using manual necrosis-rate assessments; however, necrosis rates obtained in these assessments are not reproducible and do not adequately reflect individual cell responses. We aimed to investigate whether viable tumor cell density assessed using a deep-learning model (DLM) reflects the prognosis of osteosarcoma. Seventy-one patients were included in this study. Initially, the DLM was trained to detect viable tumor cells, following which it calculated their density. Patients were stratified into high and low-viable tumor cell density groups based on DLM measurements, and survival analysis was performed to evaluate disease-specific survival and metastasis-free survival (DSS and MFS). The high viable tumor cell density group exhibited worse DSS (p = 0.023) and MFS (p = 0.033). DLM-evaluated viable density showed correct stratification of prognosis groups. Therefore, this evaluation method may enable precise stratification of the prognosis in osteosarcoma patients treated with NAC.
© 2024. The Author(s).
Conflict of interest statement
The authors declare no competing interests.
Figures


Similar articles
-
Deep Learning-Based Objective and Reproducible Osteosarcoma Chemotherapy Response Assessment and Outcome Prediction.Am J Pathol. 2023 Mar;193(3):341-349. doi: 10.1016/j.ajpath.2022.12.004. Epub 2022 Dec 21. Am J Pathol. 2023. PMID: 36563747 Free PMC article.
-
Fibrinogen-Albumin Ratio Index Exhibits Predictive Value of Neoadjuvant Chemotherapy in Osteosarcoma.Cancer Manag Res. 2022 May 5;14:1671-1682. doi: 10.2147/CMAR.S358310. eCollection 2022. Cancer Manag Res. 2022. PMID: 35547600 Free PMC article.
-
Location of residual viable tumor cells after neoadjuvant chemotherapy: A new concept with high prognostic performance in osteosarcoma.J Surg Oncol. 2017 May;115(6):752-759. doi: 10.1002/jso.24571. Epub 2017 Apr 12. J Surg Oncol. 2017. PMID: 28403564
-
P16 protein expression as a useful predictive biomarker for neoadjuvant chemotherapy response in patients with high-grade osteosarcoma: A systematic meta-analysis under guideline of PRISMA.Medicine (Baltimore). 2017 May;96(19):e6714. doi: 10.1097/MD.0000000000006714. Medicine (Baltimore). 2017. PMID: 28489748 Free PMC article. Review.
-
Tumor size and prognosis in aggressively treated osteosarcoma.J Clin Oncol. 1996 Mar;14(3):848-58. doi: 10.1200/JCO.1996.14.3.848. J Clin Oncol. 1996. PMID: 8622033 Review.
Cited by
-
A novel prognostic signature related to programmed cell death in osteosarcoma.Front Immunol. 2024 Jul 1;15:1427661. doi: 10.3389/fimmu.2024.1427661. eCollection 2024. Front Immunol. 2024. PMID: 39015570 Free PMC article.
-
A Need for Multi-Institutional Collaboration for Deep Learning-Driven Assessment of Osteosarcoma Treatment Response.Am J Pathol. 2025 Jun;195(6):1036-1039. doi: 10.1016/j.ajpath.2025.02.002. Epub 2025 Mar 7. Am J Pathol. 2025. PMID: 40056973 No abstract available.
-
Mixed reality infrastructure based on deep learning medical image segmentation and 3D visualization for bone tumors using DCU-Net.J Bone Oncol. 2024 Dec 12;50:100654. doi: 10.1016/j.jbo.2024.100654. eCollection 2025 Feb. J Bone Oncol. 2024. PMID: 39839577 Free PMC article.
References
-
- WHO. WHO Classification of Tumours of Soft Tissue & Bone. 5th edn. The WHO classification of tumours editorial board (eds) (WHO, Lyon, France, 2020).
Grants and funding
LinkOut - more resources
Full Text Sources
