

Precision prognostics for cardiovascular disease in Type 2 diabetes: a systematic review and meta-analysis
- PMID: 38253823
- PMCID: PMC10803333
- DOI: 10.1038/s43856-023-00429-z
Precision prognostics for cardiovascular disease in Type 2 diabetes: a systematic review and meta-analysis
Abstract
Background: Precision medicine has the potential to improve cardiovascular disease (CVD) risk prediction in individuals with Type 2 diabetes (T2D).
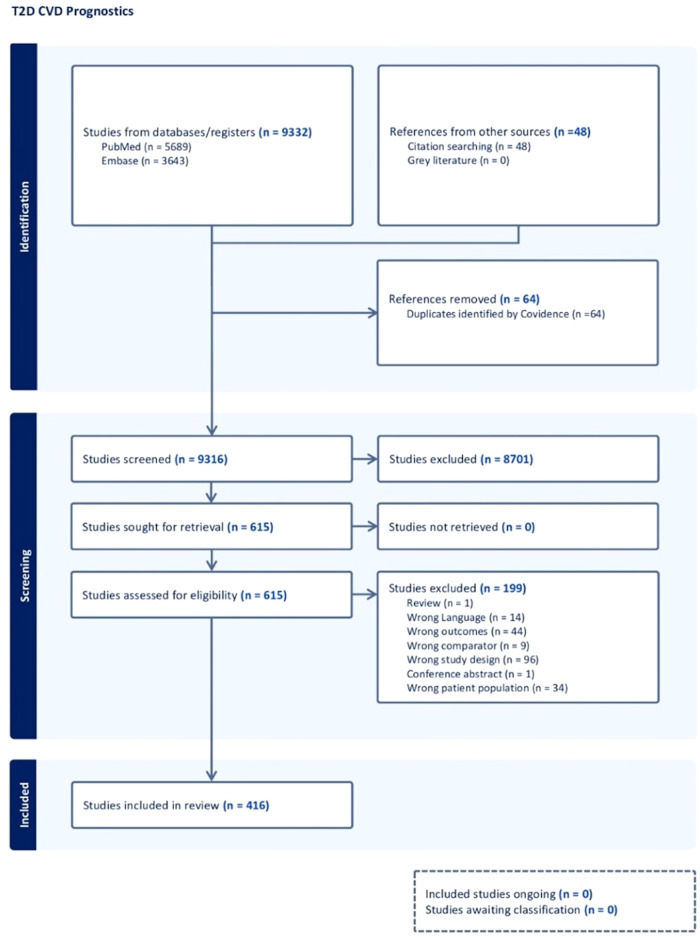
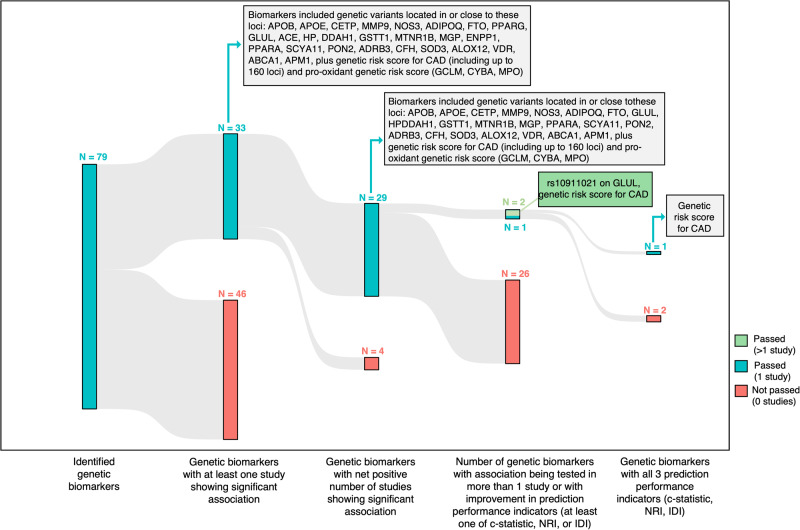
Methods: We conducted a systematic review and meta-analysis of longitudinal studies to identify potentially novel prognostic factors that may improve CVD risk prediction in T2D. Out of 9380 studies identified, 416 studies met inclusion criteria. Outcomes were reported for 321 biomarker studies, 48 genetic marker studies, and 47 risk score/model studies.
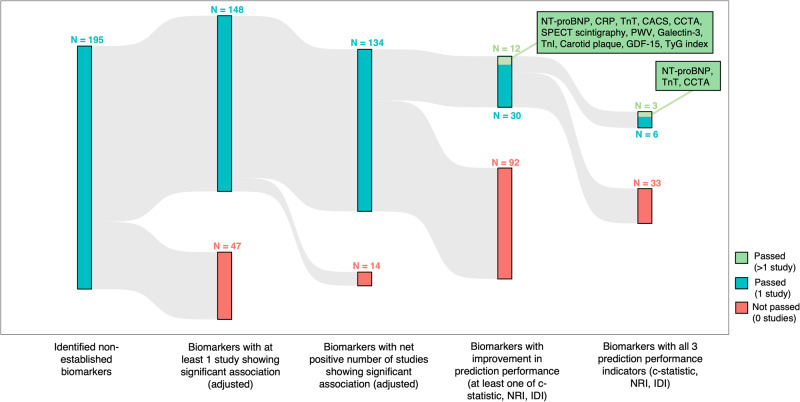
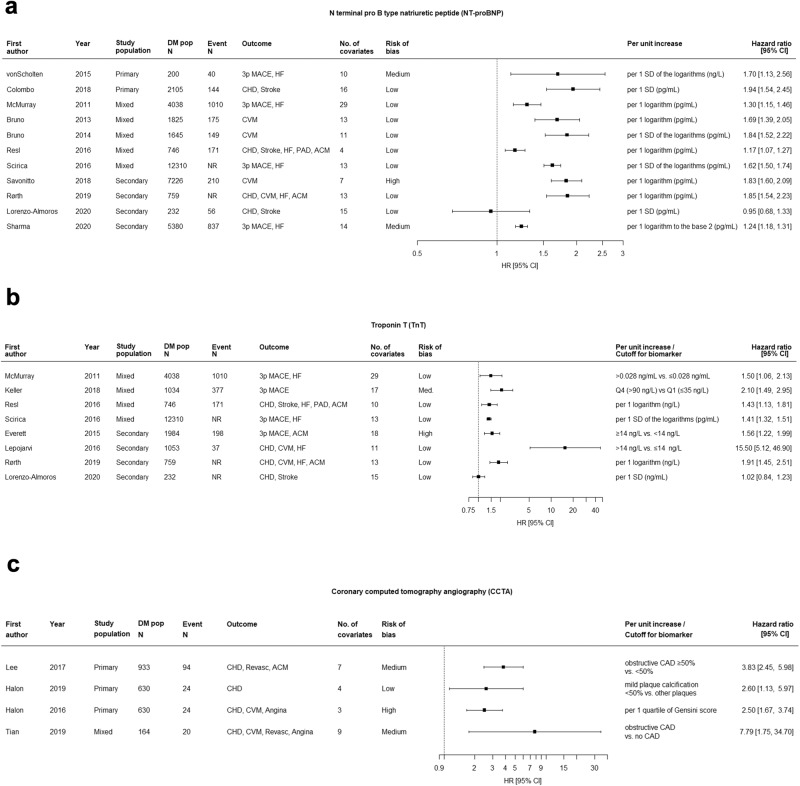
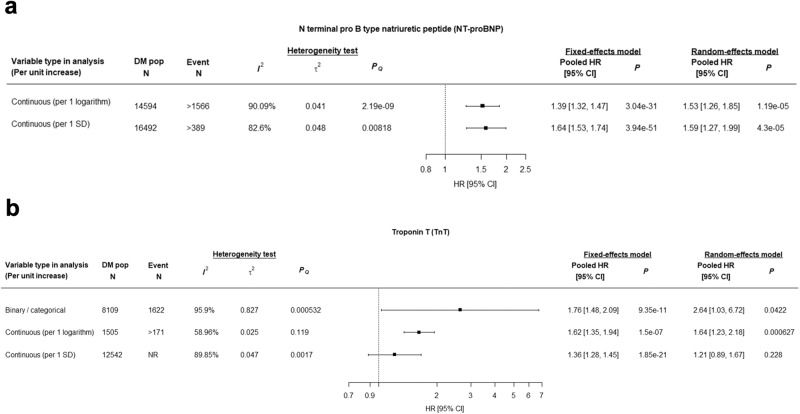
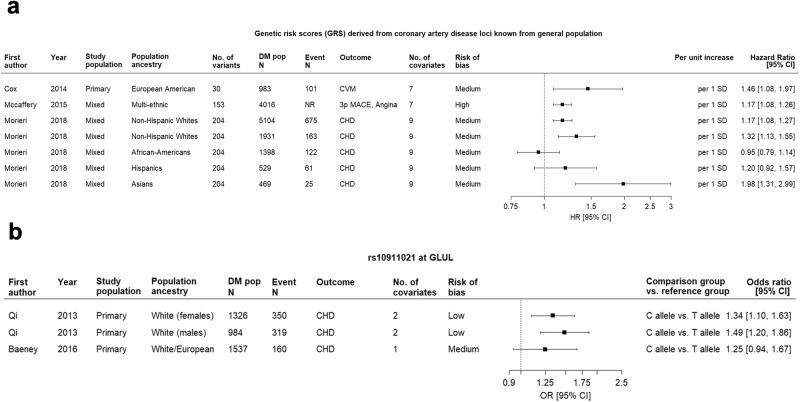
Results: Out of all evaluated biomarkers, only 13 showed improvement in prediction performance. Results of pooled meta-analyses, non-pooled analyses, and assessments of improvement in prediction performance and risk of bias, yielded the highest predictive utility for N-terminal pro b-type natriuretic peptide (NT-proBNP) (high-evidence), troponin-T (TnT) (moderate-evidence), triglyceride-glucose (TyG) index (moderate-evidence), Genetic Risk Score for Coronary Heart Disease (GRS-CHD) (moderate-evidence); moderate predictive utility for coronary computed tomography angiography (low-evidence), single-photon emission computed tomography (low-evidence), pulse wave velocity (moderate-evidence); and low predictive utility for C-reactive protein (moderate-evidence), coronary artery calcium score (low-evidence), galectin-3 (low-evidence), troponin-I (low-evidence), carotid plaque (low-evidence), and growth differentiation factor-15 (low-evidence). Risk scores showed modest discrimination, with lower performance in populations different from the original development cohort.
Conclusions: Despite high interest in this topic, very few studies conducted rigorous analyses to demonstrate incremental predictive utility beyond established CVD risk factors for T2D. The most promising markers identified were NT-proBNP, TnT, TyG and GRS-CHD, with the highest strength of evidence for NT-proBNP. Further research is needed to determine their clinical utility in risk stratification and management of CVD in T2D.
Plain language summary
People living with type 2 diabetes (T2D) are more likely to develop problems with their heart or blood circulation, known as cardiovascular disease (CVD), than people who do not have T2D. However, it can be difficult to predict which people with T2D are most likely to develop CVD. This is because current approaches, such as blood tests, do not identify all people with T2D who are at an increased risk of CVD. In this study we reviewed published papers that investigated the differences between people with T2D who experienced CVD compared to those who did not. We found some indicators that could potentially be used to determine which people with T2D are most likely to develop CVD. More studies are needed to determine how useful these are. However, they could potentially be used to enable clinicians to provide targeted advice and treatment to those people with T2D at most risk of developing CVD.
© 2024. The Author(s).
Conflict of interest statement
The authors declare the following competing interests: L-L.L. has served as an advisory committee member for Bayer, Boehringer Ingelheim, Novo Nordisk, Procter & Gamble Health, and Viatris; and as a speaker for Abbott, AstraZeneca, Boehringer Ingelheim, Merck Sharp & Dohme, Novo Nordisk, Roche, Sanofi, Servier, and Zuellig Pharma Therapeutics. She has also received research grants from Abbott, AstraZeneca, and Boehringer Ingelheim. M.L.M. received lecture fees, consultancy, or advisory board fees from Amarin, Amgen, Eli Lilly, Merck Sharp & Dohme, Mylan, Novo Nordisk, Servier, and SlaPharma, all not directly related to this manuscript. R.W.K. has received consulting fees from Novo Nordisk. M.F.G. has received financial and non-financial (in kind) support from Boehringer Ingelheim Pharma GmbH, JDRF International, Eli Lilly, AbbVie, Sanofi-Aventis, Astellas, Novo Nordisk A/S, Bayer AG within EU grant H2020-JTI-lMl2-2015-05 (Grant agreement number 115974 – BEAt-DKD). She has also received financial and in-kind support from Novo Nordisk, Pfizer, Follicum, Coegin Pharma, Abcentra, Probi, Johnson & Johnson within a project funded by the Swedish Foundation for Strategic Research on precision medicine in diabetes (LUDC-IRC #15-0067). Dr. Gomez has received personal consultancy fees from Lilly and Tribune Therapeutics AB. R.C.W.M. has received research grants from AstraZeneca, Bayer, Novo Nordisk, Pfizer, Roche Diagnostics (HK) Ltd, Tricida Inc, and consultancy/speaker honorarium from AstraZeneca, Boehringer Ingelheim, Bayer, Merck. All proceeds have been donated to the Chinese University of Hong Kong to support diabetes research. R.C.W.M. is a co-founder of GemVCare, a technology start-up initiated with support from the Hong Kong Government Innovation and Technology Commission and its Technology Start-up Support Scheme for Universities (TSSSU). R.J.dS. has served as an external resource person to the World Health Organization’s Nutrition Guidelines Advisory Group on trans fats, saturated fats, and polyunsaturated fats. The WHO paid for his travel and accommodation to attend meetings from 2012-2017 to present and discuss this work. He has presented updates of this work to the WHO in 2022. He has also done contract research for the Canadian Institutes of Health Research’s Institute of Nutrition, Metabolism, and Diabetes, Health Canada, and the World Health Organization for which he received remuneration. He has received speaker’s fees from the University of Toronto, and McMaster Children’s Hospital. He has served as an independent director of the Helderleigh Foundation (Canada). He serves as a member of the Nutrition Science Advisory Committee to Health Canada (Government of Canada), co-chair of the Method working group of the ADA/EASD Precision Medicine in Diabetes group and is a co-opted member of the Scientific Advisory Committee on Nutrition (SACN) Subgroup on the Framework for the Evaluation of Evidence (Public Health England). He has held grants from the Canadian Institutes of Health Research, Canadian Foundation for Dietetic Research, Population Health Research Institute, and Hamilton Health Sciences Corporation as a principal investigator, and is a co-investigator on several funded team grants from the Canadian Institutes of Health Research. All other authors have no competing interests to declare.
Figures

Update of
-
Precision Prognostics for Cardiovascular Disease in Type 2 Diabetes: A Systematic Review and Meta-analysis.medRxiv [Preprint]. 2023 Aug 21:2023.04.26.23289177. doi: 10.1101/2023.04.26.23289177. medRxiv. 2023. Update in: Commun Med (Lond). 2024 Jan 22;4(1):11. doi: 10.1038/s43856-023-00429-z. PMID: 37162891 Free PMC article. Updated. Preprint.
References
-
- I. D. F. Diabetes Atlas. Diabetes around the world in 2021, https://diabetesatlas.org/ (2021).
Grants and funding
LinkOut - more resources
Full Text Sources
Research Materials
Miscellaneous
