. 2024 Jan;6(1):169-186.
doi: 10.1038/s42255-023-00961-1. Epub 2024 Jan 22.

Variant of the lactase LCT gene explains association between milk intake and incident type 2 diabetes

Affiliations

Variant of the lactase LCT gene explains association between milk intake and incident type 2 diabetes

Kai Luo et al. Nat Metab. 2024 Jan.

Abstract

Cow's milk is frequently included in the human diet, but the relationship between milk intake and type 2 diabetes (T2D) remains controversial. Here, using data from the Hispanic Community Health Study/Study of Latinos, we show that in both sexes, higher milk intake is associated with lower risk of T2D in lactase non-persistent (LNP) individuals (determined by a variant of the lactase LCT gene, single nucleotide polymorphism rs4988235 ) but not in lactase persistent individuals. We validate this finding in the UK Biobank. Further analyses reveal that among LNP individuals, higher milk intake is associated with alterations in gut microbiota (for example, enriched Bifidobacterium and reduced Prevotella) and circulating metabolites (for example, increased indolepropionate and reduced branched-chain amino acid metabolites). Many of these metabolites are related to the identified milk-associated bacteria and partially mediate the association between milk intake and T2D in LNP individuals. Our study demonstrates a protective association between milk intake and T2D among LNP individuals and a potential involvement of gut microbiota and blood metabolites in this association.


Figures

Extended Data Fig. 1 |
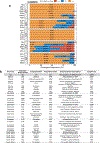
Extended Data Fig. 1 |. Genotype frequency of the LCT-rs4988235 in 1000 Genomes Project Phase 3.
(a) frequencies of genotypes by subpopulations; (b) annotations of subpopulations. Data were accessed on March 27, 2023 through http://useast.ensembl.org/Homo_sapiens/Variation/Population?r=2:135850576-135851576;v=rs4988235;vdb=variation;vf=184227258#population_freq_SAS.
Extended Data Fig. 2 |
Extended Data Fig. 2 |. Abundances of milk intake-associated gut bacterial species across milk intake levels by LCT genotype.
Abundances of milk intake-associated gut bacterial species across milk intake levels (<0.5 serving/day [n = 141 in AA/AG group, and 331 in GG group], 0.5 ~ 1.0 serving/day [n = 210 in AA/AG group and 419 in GG group], > 1 serving/day [n = 286 in AA/AG group and 380 in GG group]) by LCT genotype groups. Data are the least-squares means of centered log-ratio transferred abundances (shown as points) and the corresponding 95% confidence interval (shown as error bars) adjusted for baseline age, sex, study field center, Hispanic/Latino background, physical activity, and education, annual household income, smoking, alcohol consumption, US born status, use of probiotics or antibiotics, prevalent status of hypertension, dyslipedemia, and diabetes at the time of fecal samples collection. P-interaction (Pint) was derived from the test of the product of LCT genotype and milk intake, and P-trend was derived from linear regression with categorical milk intake modeled as an ordinal variable. All statistical tests shown in this figure were two-sided.
Extended Data Fig. 3 |
Extended Data Fig. 3 |. Glycoside hydrolases (GH) family enzymes distribution patterns of identified milk-associated Bifidobacterium species.
Data in the heatmap are abundances of GH enzymes in species, calculated as the ratios of total counts of contained enzymes with GH family to the number of reference genomes (that is, the numbers following the species in the right row annotations). Values < 1 (toward white color) indicate that less than one copy per genome of the corresponding GH family for the examined species, whereas values > 1 refer that more than one copy per reference genome was detected. Annotations of GH family number are from the carbohydrate-active enzymes (CAZy enzyme) database (http://www.cazy.org/Glycoside-Hydrolases.html). The reference genomes of assessed Bifidobacterium species were accessed through the Genome Taxonomy Database (GTDB, release 89; https://gtdb.ecogenomic.org/. Of the originally identified 7 milk-associated Bifidobacterium spp., data of B.reuteri were not available. Annotations of enzyme classes shown in the figure were summarized according to the description on the CAZypedia.org website (https://www.cazypedia.org/index.php/Main_Page).
Extended Data Fig. 4 |
Extended Data Fig. 4 |. Relationship between milk associated bacteria, metabolic traits, and incident T2D.
The top heatmap was retrieved from Fig. 3 in the main text, where bacteria species highlighted in red had positive associations with milk intake, whereas those highlighted in grey were inversely associated with milk intake. Data are partial spearman correlation coefficients adjusted for baseline age, sex, field center, Hispanic/Latino background, physical activity, education, annual household income, smoking, alcohol consumption, US nativity, use of probiotics or antibiotics, prevalent status of hypertension, dyslipidemia, and T2D at the time of fecal sample collection. The bottom forest plot shows the associations of milk-associated bacteria with incident T2D among an interim subsample of HCHS/SOL participants that included 1311 individuals who were free of T2D at the time of stool sample collection but completed the 3rd follow-up visit. Of these 1,311 individuals, 139 incident T2D cases were identified at the 3rd visit. Data are relative risks (RRs, points) and 95% confidence intervals (shown as error bars) estimated from Poisson regression models adjusted for age, sex, filed center, Hispanic/Latino background, US nativity, education, annual household income, smoking, drinking, physical activity, AHEI-2010, use of probiotics and antibiotics at the time of stool sample collection. FDR-q: false discovery rate corrected P-value.
Extended Data Fig. 5 |
Extended Data Fig. 5 |. Associations of milk-associated metabolites with incident T2D in HCHS/SOL and in ARIC.
Results of 42 metabolites in both cohorts were shown. Estimates (relative risk: RR) in HCHS/SOL were derived from survey Poisson regression models adjusted for baseline age, sex, field center, Hispanic/Latino background, education, annual household income, smoking, alcohol consumption, physical activity, prevalent status of hypertension and dyslipidemia. Estimates (harzard risk:HR) in ARIC were derived from Cox proportional hazard regression models adjusted for baseline age, sex, race/ethnicity, smoking, alcohol consumption, education, prevalent status of hypertension and dyslipidemia. Metabolite levels were inverse-normal transformed. Data are effect estimates (shown as points) and 95% confidence intervals (shown as error bars). All statistical tests shown in this figure are two-sided.
Extended Data Fig. 6 |
Extended Data Fig. 6 |. Correlation between GG specific milk-associated bacteria spp. and metabolites.
Data in the left panel were partial spearman correlation adjusted for age, sex, place of birth, study site (Uppsala or Malmö), microbial DNA extraction plate, and metabolomics delivery batch from the Swedish CArdioPulmonary bioImage Study (SCAPIS, n = 8,583) (https://gutsyatlas.serve.scilifelab.se/), while data in the right panel were partial spearman correlation adjusted for baseline age, sex, field center, Hispanic/Latino background, physical activity, education, annual household income, smoking, alcohol consumption, US nativity, use of probiotics or antibiotics, and status of hypertension, dyslipidemia, and T2D at time of fecal sample collection in the present study (HCHS/SOL, n = 804). In SCAPIS, only partial correlations with false discovery rate corrected p-value: FDR-q < 0.05 were available in the summary statistics. Cells with black bold border refer to significant results in both SCAPIS and the present study.
Extended Data Fig. 7 |
Extended Data Fig. 7 |. A summary of key findings on the altered gut microbiota species, circulating metabolites, and metabolic traits associated with milk intake in lactase non-persistent individuals (LNP: LCT GG group).
Created with BioRender.com.
Fig. 1 |
Fig. 1 |. An overview of study design and main analyses in the HCHS/SOL.
The HCHS/SOL is an ongoing prospective cohort study among 16,415 Hispanic/Latino adults of diverse backgrounds. The HCHS/SOL has collected detailed information on sociodemographic factors, health and disease conditions since baseline (2008–2011). Diet information was collected from participants using food propensity questionnaires and two 24-h diet recalls at baseline. The HCHS/SOL has profiled genetic variants in 12,803 individuals and blood metabolomics in 3,972 individuals at baseline. During the second follow-up visit (2014–2017), the HCHS/SOL profiled blood metabolomics in 814 individuals and gut metagenomics in 2,992 individuals. We conducted stratified analysis to examine the association between milk intake and incident T2D by the host lactase (LCT) genotype groups, LCT-rs4988235 GG (LNP) and AA/AG (LP). LCT genotype-stratified analyses were further conducted to identify gut microbiota and circulating metabolites associated with milk intake among LP and LNP individuals, separately. The identified LCT genotype-specific milk-associated bacteria and metabolites were then linked to T2D-related metabolic traits and incident T2D. Finally, the interrelationship between the identified LCT genotype-specific milk-related bacterial species and metabolites was examined. Created with BioRender.com.
Fig. 2 |
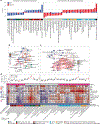
Fig. 2 |. Milk intake, LCT genotype and incident T2D.
a, Manhattan plot depicting milk intake GWAS results (n = 12,653). Genome-wide significance was set at P < 5 × 10⁻⁸ (solid line). The dashed line refers to P < 5 × 10⁻¹⁶. b, Box plots showing the distribution of daily intake of milk, cheese and yoghurt by LCT (rs4988235) genotype (n = 8,087, 3,966 and 600, for GG, AG and AA genotypes, respectively), where the numbers and centre lines in the boxes represent medians, box heights represent the interquartile range, dots represent outliers and whiskers represent ranges (excluding outliers). P values for trend (Ptrend) per alleles were derived from linear regression. c, Associations of dairy milk, cheese and yoghurt intake with incident T2D in the overall sample and by LCT genotype (GG and AA/AG) in the HCHS/SOL. Data are RRs (central points) and 95% CIs (error bars) for T2D per serving per day of milk and servings per week of cheese and yoghurt intake estimated by multivariable-adjusted Poisson regression. d, Associations of dairy milk, cheese and yoghurt intake with incident T2D in the overall sample and by LCT genotype in the UKB. Data are hazard ratios (HRs; points) and 95% CIs (error bars) from multivariable-adjusted Cox proportional hazards. Numerators and denominators in the parentheses of c and d refer to the number of T2D cases and the total number of participants in that group, respectively. e, Associations of milk intake with metabolic traits (inverse-normal transformed) at baseline stratified by LCT genotype. Data are regression coefficients (bars) and 95% CIs (error bars). f,g, Associations between daily milk intake (per serving per day) and incident T2D among 24 studies conducted in non-white (f, n = 177,797) and primarily white (g, n = 417,179) populations, respectively. Data are RRs (points) and 95% CIs (error bars). All statistical tests were two sided. BMI, body mass index; DBP, diastolic blood pressure; HbA1c, glycated haemoglobin (%); HDL-C, high-density lipoprotein cholesterol; HOMA-IR, homeostasis model assessment of insulin resistance; SBP, systolic blood pressure; WC, waist circumference.
Fig. 3 |
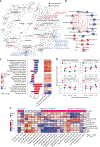
Fig. 3 |. Milk intake, LCT genotype, gut microbial species and T2D-related metabolic traits.
a, Phylogenetic tree of milk intake-associated gut bacterial species identified in LNP (LCT GG genotype, n = 1,130; blue) and LP (AA/AG, n = 637; red) individuals. Species were selected using ANCOM-II (FDR q < 0.1, detection level ≥ 0.6). b, Spearman correlation-based network of milk-associated species (n = 1,767). CLR-transformed abundances of species were used for correlation analysis. Only correlation coefficients (Coef) with a strength > 0.2 and P < 0.05 are shown. c, Bar plots (left) depicting associations of milk intake with gut microbial species by LCT genotype. Data are regression coefficients of milk intake per serving per day estimated by multivariable linear regression in LNP (n = 1,130; blue) and LP (n = 637; red) individuals, separately. Heat map (right) showing the associations of milk-associated microbial species with LACTOSECAT-PWY (that is, the lactose degradation I pathway) and phospho-β-galactosidase. Data are coefficients from multiple linear regression. Abundances of LACTOSECAT-PWY and phospho-β-galactosidase were CLR transformed. d, Abundances of representative milk-associated species by levels of milk intake and LCT genotype (in GG group, n = 331, 419 and 380 for levels of <0.5, 0.5–1.0 and >1.0 servings per day, respectively; in AA/AG group, n = 141, 210 and 286 for levels of <0.5, 0.50–1.0 and >1.0 servings per day, respectively). Data are least square means of CLR-transformed abundances (points) and 95% CIs (error bars) derived from multiple linear regression. Pint values were derived from testing the cross-product terms between species and milk intake, and Ptrend values across levels of milk intake were derived from regression with milk intake levels modelled as an ordinal variable. e, Correlation between milk-associated species (spp.) and metabolic traits in the overall sample (n = 2,970). Data are Spearman correlation coefficients from partial correlation analyses. The GG and AA/AG species scores were calculated based on GG-specific and AA/AG-specific milk-associated species, respectively, by summing up CLR-transformed abundances of species weighted by their regression coefficients with milk intake. All statistical tests were two sided.
Fig. 4 |
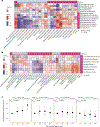
Fig. 4 |. Milk intake, LCT genotype, circulating metabolites and risk of T2D.
a, Bar plots showing associations of milk intake with circulating metabolites by LCT genotype (GG, n = 1,946, blue; AA/AG, n = 1,164, red). Data are coefficients estimated by linear regression. GG-specific milk-associated metabolites refer to metabolites significantly associated with milk intake only in GG group (that is, LNP individuals; FDR q < 0.05 in LNP and P > 0.1 in LP individuals). AA/AG-specific milk-associated metabolites were defined in the same way. b, Univariate Spearman correlation (Cor)-based network among GG-specific milk-associated metabolites in all participants regardless of LCT genotype (n = 3,110). Only correlation coefficients with a strength > 0.15 and P < 0.05 are shown. c, Univariate Spearman correlation-based network among AA/AG-specific milk-associated metabolites. Only correlation coefficients with a strength > 0.2 and P < 0.05 are shown. Levels of metabolites in b and c were inverse-normal transformed. d, Associations of LCT genotype-specific milk-associated metabolites with incident T2D (top) and with metabolic traits at baseline (bottom) among all participants (n = 2,163). RRs (points; top) and 95% CI (error bars) for T2D per s.d. increment of metabolite or metabolite score estimated by Poisson regression are shown. Data in the bottom heat map are partial Spearman correlation coefficients derived from partial correlation analyses among 3,936 individuals (PCor). The GG and AA/AG metabolite scores were calculated based on GG-specific and AA/AG-specific milk-associated metabolites, respectively, by summing up values of metabolites (inverse-normal transformed) weighted by their regression coefficients with milk intake. FDR correction was not applied for metabolite scores. All statistical tests were two sided. AAs, amino acids; BAs, bile acids; IPA, indolepropionate; LPLs, lysophospholipids; LCFAs, long-chain fatty acids; PFAs, polyunsaturated fatty acids; MGs, monoacylglycerols; SMCYS, S-methylcysteines; Cers/SMs, ceramides and sphingomyelins.
Fig. 5 |
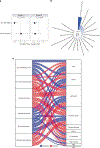
Fig. 5 |. LCT genotype-specific milk-associated metabolites explain the milk–LCT interaction on risk of T2D.
a, Associations of milk intake with incident T2D with and without adjustment for the identified LCT genotype-specific milk-associated metabolites in all participants (n = 2,164). Data are the RRs (points) and 95% CIs (error bars) from Poisson regression. Model 1 was adjusted for baseline age, sex, field centre, Hispanic/Latino background, education, annual household income, smoking, alcohol consumption, physical activity, hypertension, dyslipidaemia and total energy intake. Model 2 was further adjusted for 20 GG-specific and 33 AA/AG-specific milk-associated metabolites. Numerators and denominators in the parentheses refer to the number of T2D cases and total number of participants in that group, respectively. Pint values were derived from the test of the product term between milk intake and LCT genotype in the above Poisson regression. b, Mediating effects of GG-specific milk-associated metabolites and the metabolite score in the association between milk intake and incident T2D in LNP individuals (n = 1,367). Data are the proportion of mediated effects from mediation analysis models, adjusting for baseline age, sex, field centre, Hispanic/Latino background, education, annual household income, smoking, alcohol consumption, physical activity, total energy intake and prevalent status of hypertension and dyslipidaemia. The asterisk indicates that the proportion of mediated effects (PM), that is, the ratio of indirect effect to total effect, was significant (P < 0.05). c, Alluvial plot depicting the mediating effects of baseline metabolic traits in the associations of the metabolite score and five individual metabolites with incident T2D in LNP individuals (n = 1,367). Colour of alluvia refers to the direction of associations between metabolites/metabolite score and metabolic traits (positive associations in red, negative associations in blue). Size of alluvia indicates the magnitude of the proportion of mediated effects of corresponding traits. All statistical tests were two sided.
Fig. 6 |
Fig. 6 |. Relationship between LCT genotype-specific milk-associated gut bacterial species and metabolites.
a, Correlation between GG-specific milk-associated species and metabolites (n = 804). Data are partial Spearman correlation coefficients, adjusting for baseline age, sex, field centre, Hispanic/Latino background, physical activity, education, annual household income, smoking, alcohol consumption, US nativity, use of probiotics or antibiotics, and prevalent status of hypertension, dyslipidaemia and T2D at the time of faecal sample collection. b, Correlation between AA/AG-specific milk-associated species and metabolites (n = 804). Data are partial Spearman correlation coefficients adjusted for covariates in a. c, Associations of LCT genotype-specific milk-associated species score (quartiles) with LCT genotype-specific milk-associated metabolite score, adjusting for covariates in a. Data are regression coefficients (points) and 95% CI (error bars). Ptrend values across levels of milk intake were derived from regression with categorical species score modelled as an ordinal variable. All statistical tests were two sided.

References

    1. Pereira PC Milk nutritional composition and its role in human health. Nutrition 30, 619–627 (2014). - PubMed
    1. Gijsbers L et al. Consumption of dairy foods and diabetes incidence: a dose-response meta-analysis of observational studies. Am. J. Clin. Nutr. 103, 1111–1124 (2016). - PubMed
    1. Alvarez-Bueno C et al. Effects of milk and dairy product consumption on type 2 diabetes: overview of systematic reviews and meta-analyses. Adv. Nutr. 10, S154–S163 (2019). - PMC - PubMed
    1. Segurel L & Bon C On the evolution of lactase persistence in humans. Annu Rev. Genomics Hum. Genet. 18, 297–319 (2017). - PubMed
    1. Storhaug CL, Fosse SK & Fadnes LT Country, regional, and global estimates for lactose malabsorption in adults: a systematic review and meta-analysis. Lancet Gastroenterol. Hepatol. 2, 738–746 (2017). - PubMed

Grants and funding