

Trend analysis and prediction of gonorrhea in mainland China based on a hybrid time series model
- PMID: 38253998
- PMCID: PMC10802032
- DOI: 10.1186/s12879-023-08969-4
Trend analysis and prediction of gonorrhea in mainland China based on a hybrid time series model
Abstract
Background: Gonorrhea has long been a serious public health problem in mainland China that requires attention, modeling to describe and predict its prevalence patterns can help the government to develop more scientific interventions.
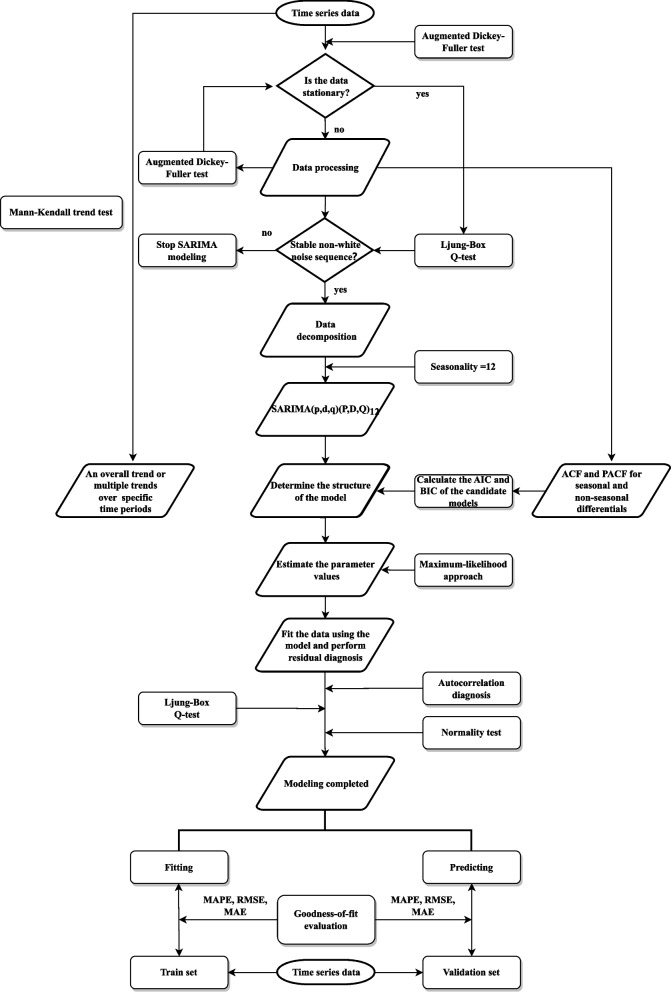
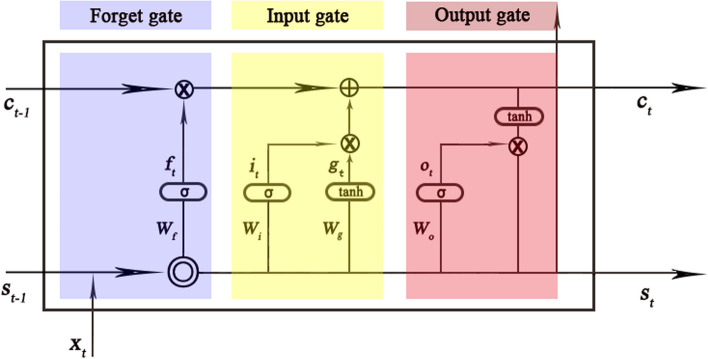
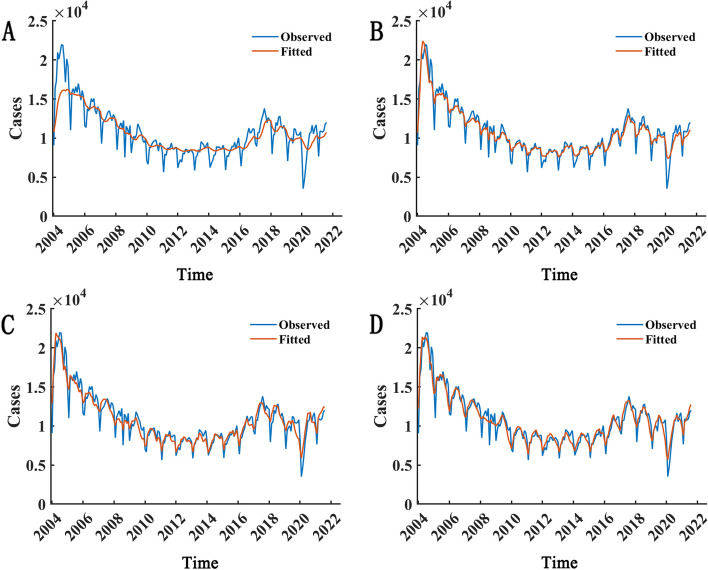
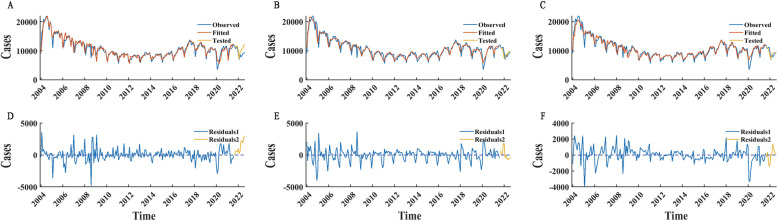
Methods: Time series (TS) data of the gonorrhea incidence in China from January 2004 to August 2022 were collected, with the incidence data from September 2021 to August 2022 as the validation. The seasonal autoregressive integrated moving average (SARIMA) model, long short-term memory network (LSTM) model, and hybrid SARIMA-LSTM model were used to simulate the data respectively, the model performance were evaluated by calculating the mean absolute percentage error (MAPE), root mean square error (RMSE), and mean absolute error (MAE) of the training and validation sets of the models.
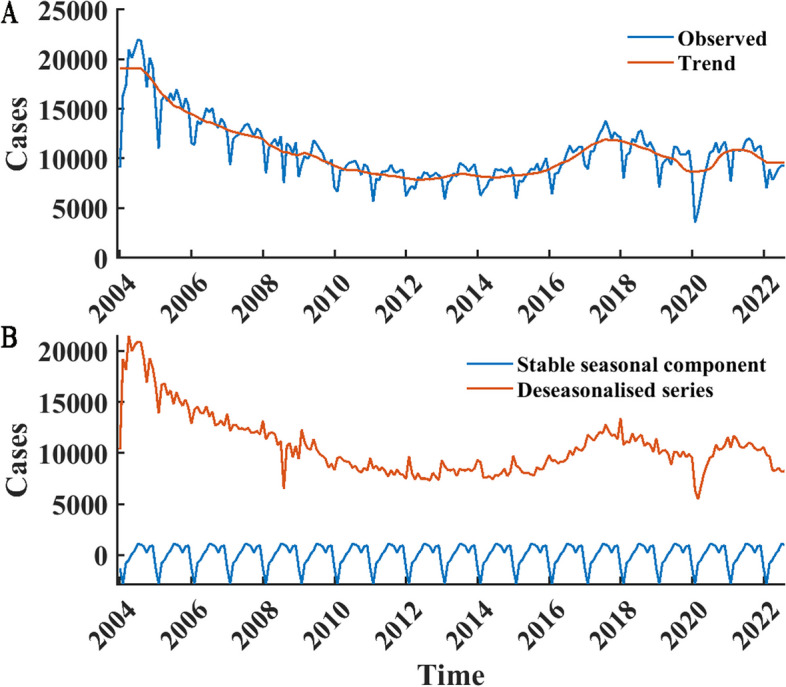
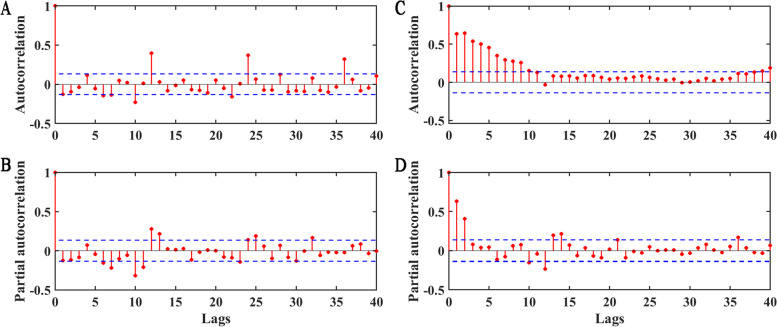
Results: The Seasonal components after data decomposition showed an approximate bimodal distribution with a period of 12 months. The three models identified were SARIMA(1,1,1) (2,1,2)12, LSTM with 150 hidden units, and SARIMA-LSTM with 150 hidden units, the SARIMA-LSTM model fitted best in the training and validation sets, for the smallest MAPE, RMSE, and MPE.
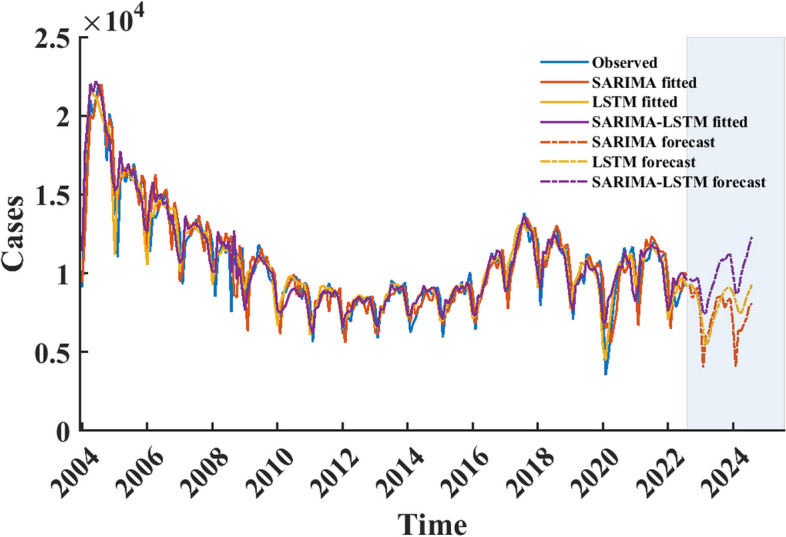
Conclusions: The overall incidence trend of gonorrhea in mainland China has been on the decline since 2004, with some periods exhibiting an upward trend. The incidence of gonorrhea displays a seasonal distribution, typically peaking in July and December each year. The SARIMA model, LSTM model, and SARIMA-LSTM model can all fit the monthly incidence time series data of gonorrhea in mainland China. However, in terms of predictive performance, the SARIMA-LSTM model outperforms the SARIMA and LSTM models, with the LSTM model surpassing the SARIMA model. This suggests that the SARIMA-LSTM model can serve as a preferred tool for time series analysis, providing evidence for the government to predict trends in gonorrhea incidence. The model's predictions indicate that the incidence of gonorrhea in mainland China will remain at a high level in 2024, necessitating that policymakers implement public health measures in advance to prevent the spread of the disease.
Keywords: Gonorrhea; LSTM; Modeling; SARIMA.
© 2024. The Author(s).
Conflict of interest statement
The authors declare no competing interests.
Figures
Similar articles
-
Analysis and forecasting of syphilis trends in mainland China based on hybrid time series models.Epidemiol Infect. 2024 May 27;152:e93. doi: 10.1017/S0950268824000694. Epidemiol Infect. 2024. PMID: 38800855 Free PMC article.
-
Study on the prediction effect of a combined model of SARIMA and LSTM based on SSA for influenza in Shanxi Province, China.BMC Infect Dis. 2023 Feb 6;23(1):71. doi: 10.1186/s12879-023-08025-1. BMC Infect Dis. 2023. PMID: 36747126 Free PMC article.
-
A new hybrid model SARIMA-ETS-SVR for seasonal influenza incidence prediction in mainland China.J Infect Dev Ctries. 2023 Nov 30;17(11):1581-1590. doi: 10.3855/jidc.18037. J Infect Dev Ctries. 2023. PMID: 38064398
-
A hybrid model for tuberculosis forecasting based on empirical mode decomposition in China.BMC Infect Dis. 2023 Oct 7;23(1):665. doi: 10.1186/s12879-023-08609-x. BMC Infect Dis. 2023. PMID: 37805543 Free PMC article.
-
Temporal trends analysis of tuberculosis morbidity in mainland China from 1997 to 2025 using a new SARIMA-NARNNX hybrid model.BMJ Open. 2019 Jul 31;9(7):e024409. doi: 10.1136/bmjopen-2018-024409. BMJ Open. 2019. PMID: 31371283 Free PMC article.
Cited by
-
Prediction of monthly occurrence number of scrub typhus in Ganzhou City, China, based on SARIMA and BPNN models.Infect Dis Model. 2025 Feb 13;10(2):691-701. doi: 10.1016/j.idm.2025.02.009. eCollection 2025 Jun. Infect Dis Model. 2025. PMID: 40070443 Free PMC article.
-
Trends in Antibiotic Resistance in Uropathogens at Mbarara Regional Referral Hospital (2019-2024): A Retrospective Study.Infect Drug Resist. 2025 Aug 4;18:3875-3890. doi: 10.2147/IDR.S523848. eCollection 2025. Infect Drug Resist. 2025. PMID: 40787228 Free PMC article.
References
-
- World Health Organization . Sexually transmitted infections (STIs) 2022.
-
- World Health Organization . Multi-drug resistant gonorrhoea. 2022.
-
- National Health Commission of the People’s Republic of China. National epidemic profile of statutory infectious diseases in 2021, 2022 http://www.nhc.gov.cn/jkj/s3578/202204/4fd88a291d914abf8f7a91f6333567e1..... [Accessed 13 Mar 2023].
MeSH terms
LinkOut - more resources
Full Text Sources
Medical
