. 2024 Jan 23;31(1):12.
doi: 10.1186/s12929-024-01001-0.

TEM1/endosialin/CD248 promotes pathologic scarring and TGF-β activity through its receptor stability in dermal fibroblasts

Affiliations

TEM1/endosialin/CD248 promotes pathologic scarring and TGF-β activity through its receptor stability in dermal fibroblasts

Yi-Kai Hong et al. J Biomed Sci. .

Abstract

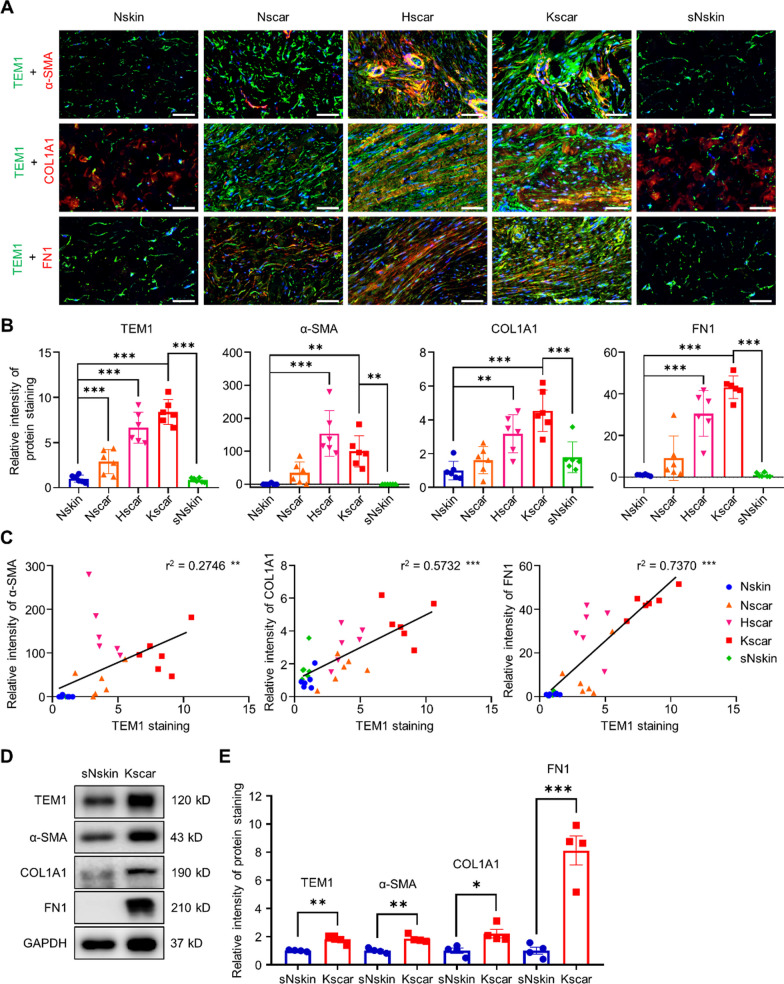
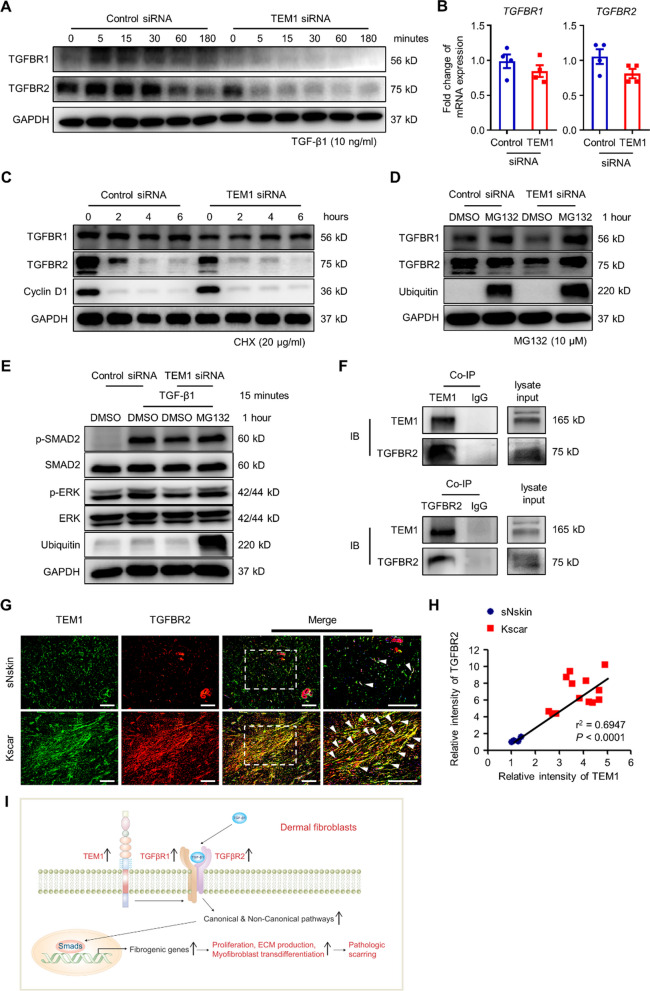
Background: Pathologic scars, including keloids and hypertrophic scars, represent a common form of exaggerated cutaneous scarring that is difficult to prevent or treat effectively. Additionally, the pathobiology of pathologic scars remains poorly understood. We aim at investigating the impact of TEM1 (also known as endosialin or CD248), which is a glycosylated type I transmembrane protein, on development of pathologic scars.

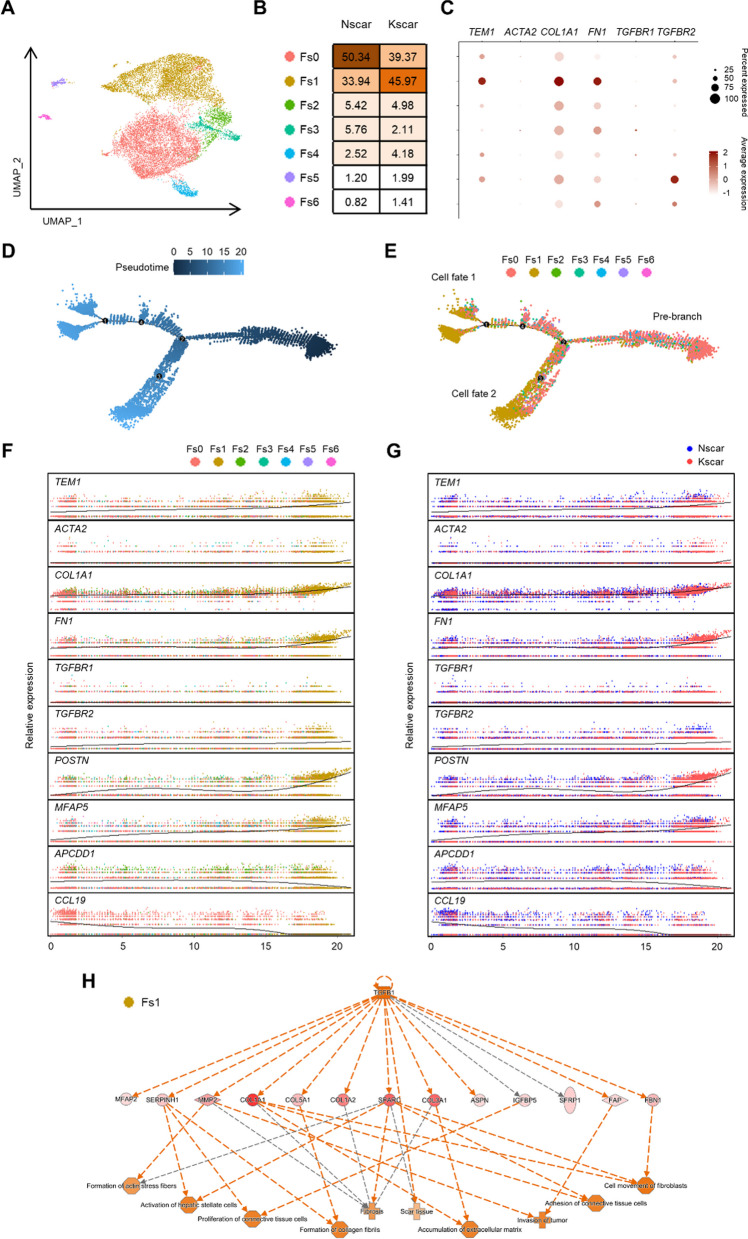
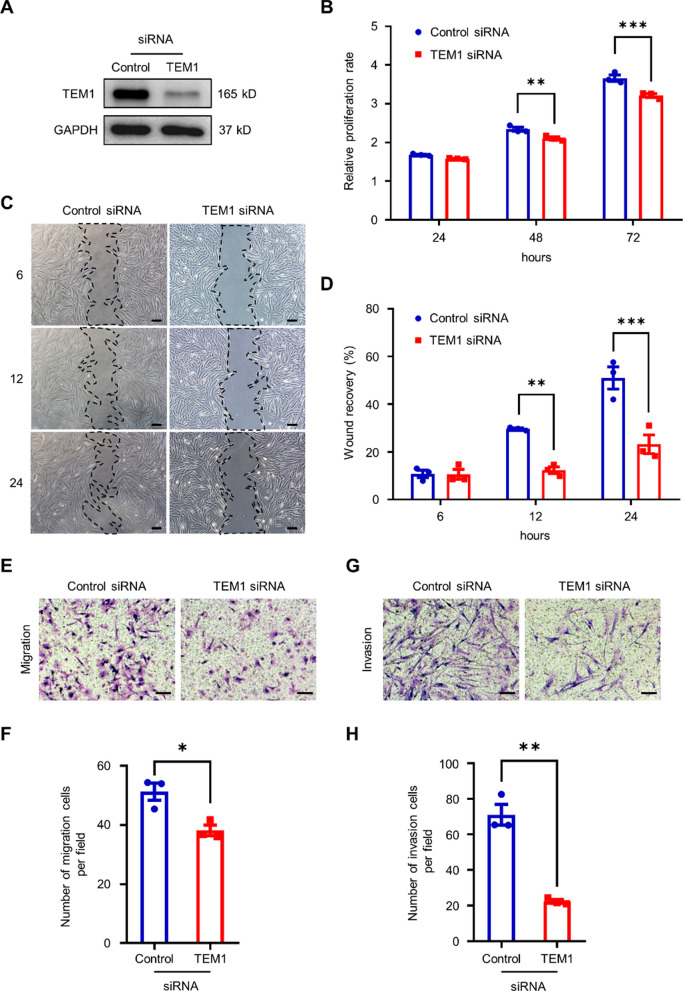
Methods: To investigate the expression of TEM1, we utilized immunofluorescence staining, Western blotting, and single-cell RNA-sequencing (scRNA-seq) techniques. We conducted in vitro cell culture experiments and an in vivo stretch-induced scar mouse model to study the involvement of TEM1 in TGF-β-mediated responses in pathologic scars.

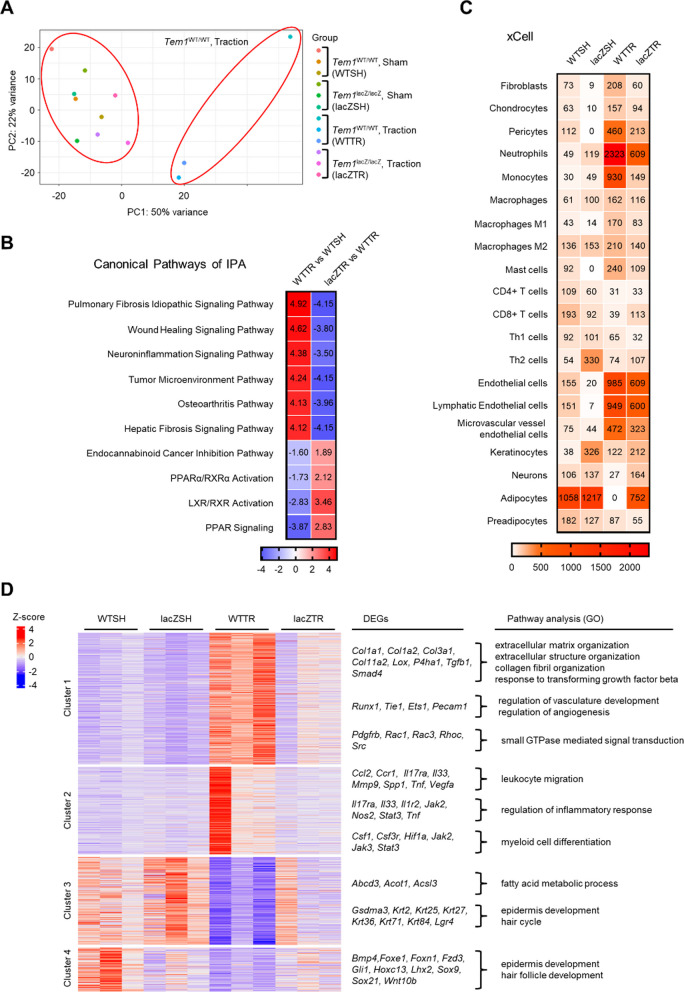
Results: The levels of the protein TEM1 are elevated in both hypertrophic scars and keloids in comparison to normal skin. A re-analysis of scRNA-seq datasets reveals that a major profibrotic subpopulation of keloid and hypertrophic scar fibroblasts greatly expresses TEM1, with expression increasing during fibroblast activation. TEM1 promotes activation, proliferation, and ECM production in human dermal fibroblasts by enhancing TGF-β1 signaling through binding with and stabilizing TGF-β receptors. Global deletion of Tem1 markedly reduces the amount of ECM synthesis and inflammation in a scar in a mouse model of stretch-induced pathologic scarring. The intralesional administration of ontuxizumab, a humanized IgG monoclonal antibody targeting TEM1, significantly decreased both the size and collagen density of keloids.

Conclusions: Our data indicate that TEM1 plays a role in pathologic scarring, with its synergistic effect on the TGF-β signaling contributing to dermal fibroblast activation. Targeting TEM1 may represent a novel therapeutic approach in reducing the morbidity of pathologic scars.

Keywords: Fibroblast activation; Hypertrophic scar; Keloid; TEM1/endosialin/CD248; TGF-β.


Conflict of interest statement

The authors state no conflict of interest.

Figures

Fig. 1
Fig. 1
TEM1 protein expression is upregulated in keloids. A The tissue sections from normal skin (Nskin, n = 6), normal scar (Nscar, n = 6), hypertrophic scar (Hscar, n = 6), keloid scar (Kscar, n = 6), and surrounding normal skin of keloid (sNskin, n = 6) are immunostained for TEM1, α-SMA, COL1A1, and FN1. The nucleus is stained with DAPI. Scale bar = 50 μm. B The integrated density of each protein for each field in the dermis is determined using ImageJ software in a blinded manner. The random 5 fields of each samples are scanned and then quantified. The fold change of integrated intensity of TEM1 protein expression in each group is determined with reference to Nskin. C Pearson correlation compares TEM1 intensity with α-SMA, COL1A1, and FN1 intensity respectively in skin tissues. D The protein levels of TEM1, α-SMA, COL1A1, FN1, and GAPDH expression in tissues of sNskin (n = 4) and Kscar (n = 4) are analyzed using Western blotting. E The intensity of each protein expression relative to GAPDH is calculated based on the results of Western blotting. The fold change of relative intensity of each protein expression in keloids is compared with normal skin. Bar graphs show mean ± SEM. * P < 0.05, ** P < 0.01, *** P < 0.001. P-values are determined by one-way analysis of variance or pearson correlation analysis
Fig. 2
Fig. 2
TEM1-positive fibroblasts represent the predominant and active fibroblast population in keloids at single-cell resolution. A The subclusters of all fibroblasts from Nscar and Kscar are further classified into 7 distinct subtypes (Fs0–Fs6). B Percentages of each fibroblast subgroup in normal scars and keloids are presented. C Sets of distinctly expressed genes in all fibroblast subsets are shown by dot plots. D, E The pseudo-temporal ordering of fibroblasts displays a branched trajectory. The distribution of each of the 7 subpopulations is plotted on each branch. F, G Kinetic plots show the relative expression pattern of 10 selected genes in all fibroblasts from Fs0 to Fs1 or from normal scars to keloids through pseudotime. H Upstream analysis based on DEGs in Fs1 is performed using IPA software
Fig. 3
Fig. 3
Knockout of Tem1 in mice markedly reduces pathologic scar formation induced by mechanical stretching. A A flowchart for a mouse model of stretch-induced hypertrophic scarring. In brief, on post-wounding day 6, traction force in the traction group (n = 11 for Tem1WT/WT mice and 13 for Tem1lacZ/lacZ mice) is induced by 1 mm/day of elongation using a plastic device, for a total of 8 mm. The non-stretched scar with the plastic device is the sham control (n = 10 for Tem1WT/WT mice and 7 for Tem1lacZ/lacZ mice). B, C The gross scar in the Tem1WT/WT and Tem1lacZ/lacZ mice with or without traction force is captured by dissecting microscope and then quantified by ImageJ. Scale bar = 5 mm. D, E The scar tissues of the Tem1WT/WT and Tem1lacZ/lacZ mice with or without traction force are stained with H&E stain for histologic observation. The scar area is quantified by ImageJ. F–I Integrated intensity of collagen deposition in the scar area of the Tem1WT/WT and Tem1lacZ/lacZ mice with or without traction force is detected using Masson’s trichrome stain (F, G) and picrosirius red stain (H, I) and is quantified using ImageJ in a blinded manner. Scale bar = 1 mm. Bar graphs show mean ± SEM. ** P < 0.01, *** P < 0.001. P-values are determined by two-way analysis of variance
Fig. 4
Fig. 4
Molecular profiling by RNA-sequencing reveals that Tem1 deficiency in mice mitigates stretch-mediated fibrosis and inflammation during scar progression. A The scar tissues from Tem1WT/WT and Tem1lacZ/lacZ mice with or without traction force (n = 3 for each group) is subjected to RNA-sequencing. Principal component analysis reveals distinct changes across four groups. B Canonical pathways are analyzed by IPA software following DEGs. C Cell type inference for each group is predicted by xCell software. D Cluster methods are conducted by the tidyverse package to explore gene expression patterns. The gene ontology biological processes of DEGs in each cluster are analyzed by the clusterProfiler package. Tem1WT/WT mice without traction force (sham group), WTSH; Tem1lacZ/lacZ mice without traction force (sham group), lacZSH; Tem1WT/WT mice with traction force (traction group), WTTR; Tem1lacZ/lacZ mice with traction force (traction group), lacZTR
Fig. 5
Fig. 5
TEM1 is involved in the cell proliferation, migration, and invasion of keloid fibroblasts. A TEM1-knockdown KFs are established by transfection with TEM1 small interfering RNA (TEM1 siRNA). Non-target siRNA is regarded as control siRNA. The protein level of TEM1 expression is assayed by Western blotting. B The cell viability of fibroblasts in 10% FBS is measured by WST-1 assay. Proliferation rate at 24, 48, and 72 h relative to that at 0 h is shown. C–F The cell migration ability of fibroblasts is measured by wound healing assay (C, D) and transwell migration assay (E, F) with 10% FBS as the chemoattractant. Scale bar = 100 μm. G, H The cell invasion of fibroblasts is assayed using a Matrigel-coated transwell migration assay with 10% FBS as the chemoattractant. Scale bar = 100 μm. Bar graphs show mean ± SEM. * P < 0.05, ** P < 0.01, *** P < 0.001. P-values are determined by unpaired two-tailed Student’s t-test and two-way analysis of variance
Fig. 6
Fig. 6
TEM1 is essential for TGF-β1-mediated activity in dermal fibroblasts. A The TEM1 gene in NHDFs is knocked down by transfection with TEM1 small interfering RNA (TEM1 siRNA), as compared with non-target siRNA (control siRNA). The protein level of TEM1 expression is assayed using Western blotting. B The amount of protein expression, including α-SMA, COL1A1, FN1, and GAPDH, in NHDFs treated with TGF-β1 (10 ng/ml) for 0, 12, 24, and 48 h is analyzed using Western blotting. C The protein levels of p- SMAD2, SMAD2, p-ERK, ERK, and GAPDH expression in NHDFs treated with TGF-β1 (10 ng/ml) for 0, 5, 15, 30, 60, and 180 min are detected by Western blotting. D The nuclear translocation of SMAD2 in NHDFs after the administration of TGF-β1 (10 ng/ml) is observed by immunofluorescence. E The nuclear SMAD2 ratio relative to DAPI is quantified by ImageJ. Scale bar = 100 μm. F The TEM1 gene in NFs and KFs is knocked down by TEM1 siRNA. The protein level of TEM1 expression is detected using Western blotting. G The protein levels of p-SMAD2, SMAD2, p-ERK, ERK, and GAPDH expression in NFs and KFs treated with TGF-β1 (10 ng/ml) for 0, 15, and 30, minutes are identified by Western blotting. H, I The cell viability of NFs (H) and KFs (I) in response to TGF-β1 (10 ng/ml) is measured by WST-1 assay. The proliferation at 24, 48, and 72 h relative to that at 0 h is shown. Bar graphs show mean ± SEM. * P < 0.05, ** P < 0.01, *** P < 0.001. P-values are determined by two-way analysis of variance
Fig. 7
Fig. 7
TEM1 regulates the stabilization of TGF-β receptors. A The protein levels of TGFBR1 and TGFBR2 expression on NHDFs transfected with TEM1 siRNA in response to TGF-β (10 ng/ml) for 0, 5, 15, 30, 60, and 180 min are determined using Western blotting. B The mRNA levels of TGFBR1 and TGFBR2 expression from the cell lysates of transfected NHDFs are detected by real-time PCR. C The protein levels of TGFBR1, TGFBR2, cyclin D1, and GAPDH expression on transfected NHDFs after treatment with cycloheximide (CHX) (20 μg/ml) for 0, 2, 4, and 6 h are determined by Western blotting. D The protein levels of TGFBR1, TGFBR2, ubiquitin, and GAPDH expression on transfected NHDFs treated with MG132 (10 μM) for 1 h are examined by Western blotting. E The protein levels of p- SMAD2, SMAD2, p-ERK, ERK, ubiquitin, and GAPDH expression on transfected NHDFs treated with MG132 (10 μM) for 1 h and then TGF-β1 (10 ng/ml) for 15 min are assayed by Western blotting. F Lysate from NHDFs cultured with 10% FBS DMEM is co-immunoprecipitated with the TEM1 antibody and immunoblotted with the TGFBR2 antibody. G The tissue sections from normal skins (n = 4) and keloids (n = 13) are immunostained for TEM1 and TGFBR2. The nucleus is stained with DAPI. Scale bar = 100 μm. H A positive correlation between TEM1 and TGFBR2 is determined by linear regression. I This schematic illustrates the role of TEM1 in pathologic scarring. Bar graphs show mean ± SEM

References

    1. Abdou AG, Maraee AH, Al-Bara AM, Diab WM. Immunohistochemical expression of TGF-β1 in keloids and hypertrophic scars. Am J Dermatopathol. 2011;33(1):84–91. doi: 10.1097/DAD.0b013e3181d0c3ad. - DOI - PubMed
    1. Akhurst RJ, Hata A. Targeting the TGFβ signalling pathway in disease. Nat Rev Drug Discov. 2012;11(10):790–811. doi: 10.1038/nrd3810. - DOI - PMC - PubMed
    1. Al-Salihi MA, Herhaus L, Sapkota GP. Regulation of the transforming growth factor β pathway by reversible ubiquitylation. Open Biol. 2012;2(5):120082. doi: 10.1098/rsob.120082. - DOI - PMC - PubMed
    1. Altman N, Krzywinski M. Clustering. Nat Methods. 2017;14(6):545–546. doi: 10.1038/nmeth.4299. - DOI
    1. Altman N, Krzywinski M. Points of significance: clustering. Nat Methods. 2017;14(6):545–547. doi: 10.1038/nmeth.4299. - DOI - PMC - PubMed