. 2024 Jan 23;43(1):27.
doi: 10.1186/s13046-023-02930-8.

HDAC1/2 control mesothelium/ovarian cancer adhesive interactions impacting on Talin-1-α5β1-integrin-mediated actin cytoskeleton and extracellular matrix protein remodeling

Affiliations

HDAC1/2 control mesothelium/ovarian cancer adhesive interactions impacting on Talin-1-α5β1-integrin-mediated actin cytoskeleton and extracellular matrix protein remodeling

Michela Terri et al. J Exp Clin Cancer Res. .

Abstract

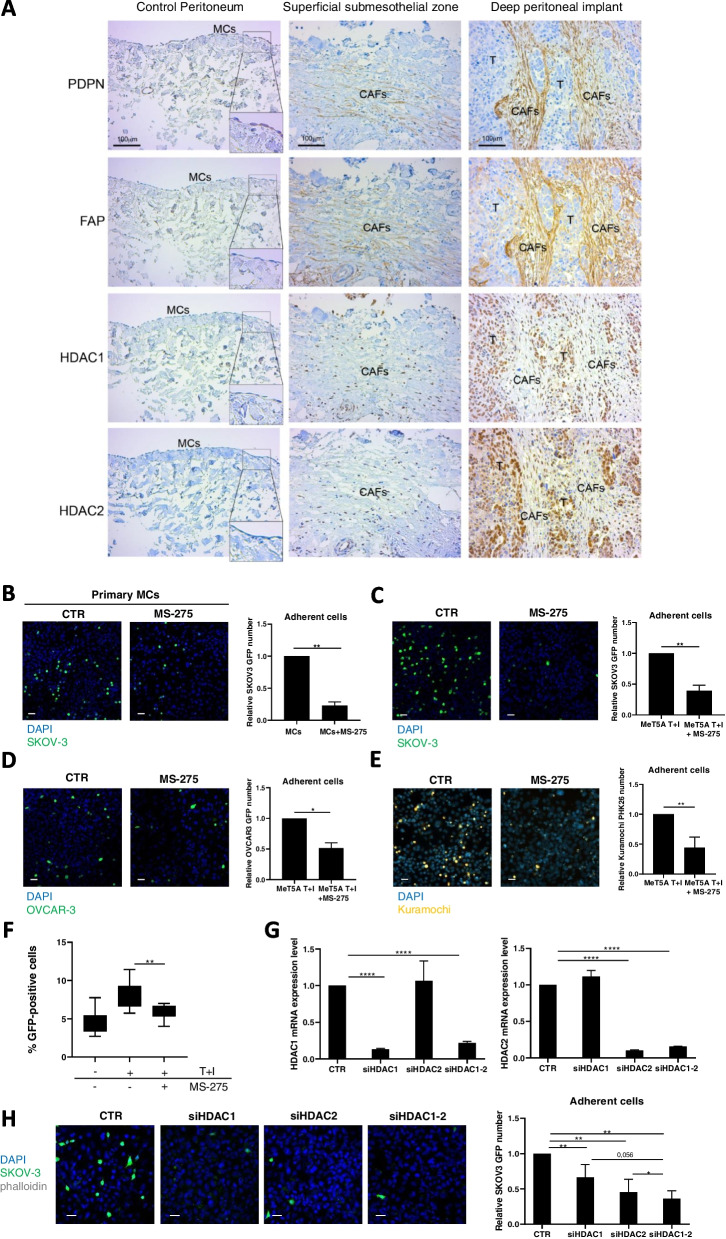
Background: Peritoneal metastasis, which accounts for 85% of all epithelial ovarian carcinoma (EOC) metastases, is a multistep process that requires the establishment of adhesive interactions between cancer cells and the peritoneal membrane. Interrelations between EOC and the mesothelial stroma are critical to facilitate the metastatic process. No data is available so far on the impact of histone acetylation/deacetylation, a potentially relevant mechanism governing EOC metastasis, on mesothelial cells (MCs)-mediated adhesion.

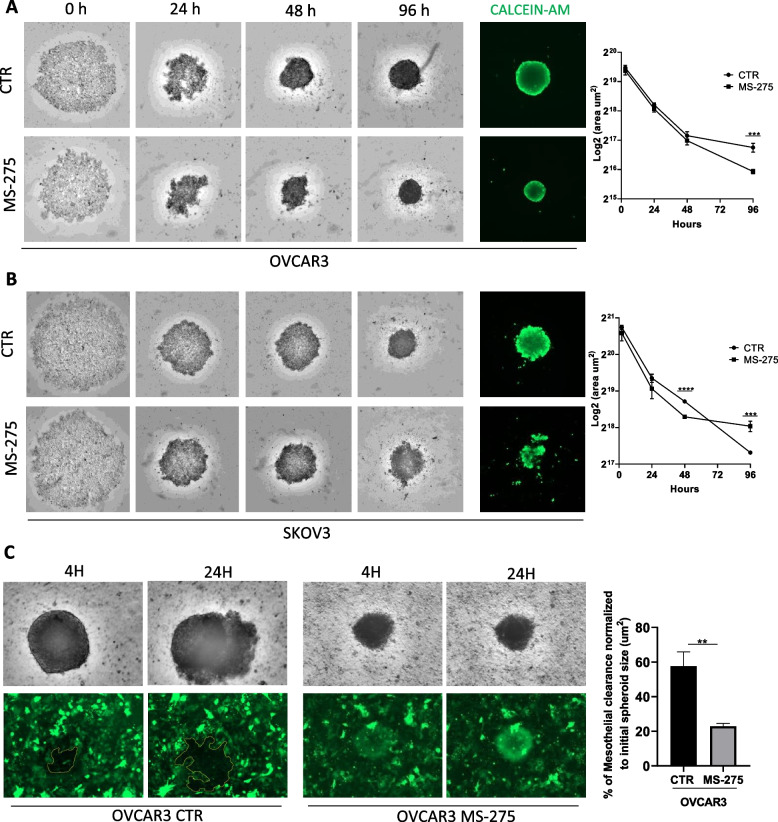
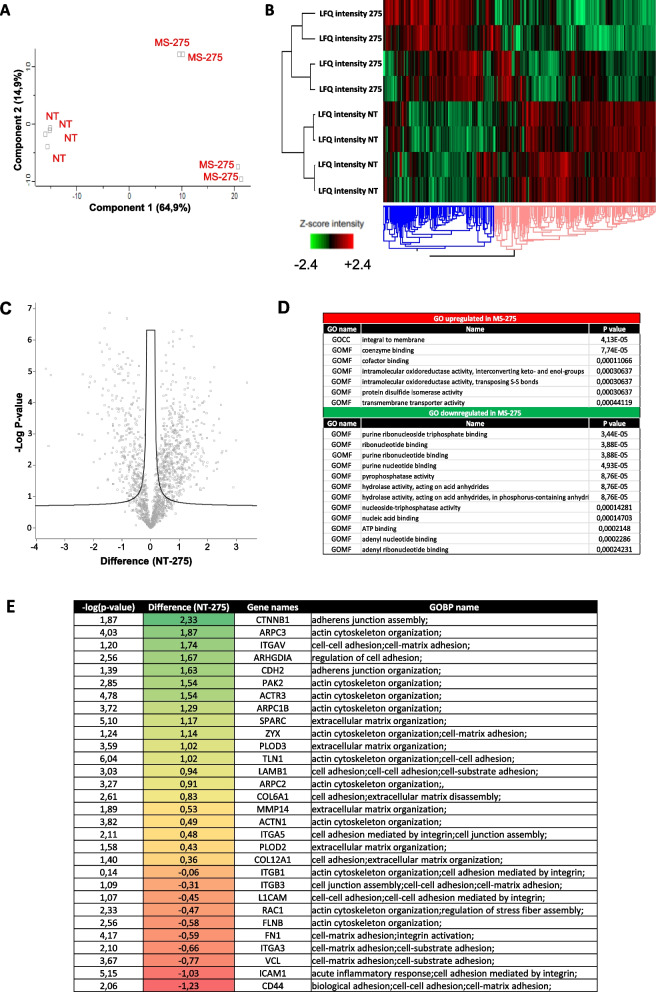
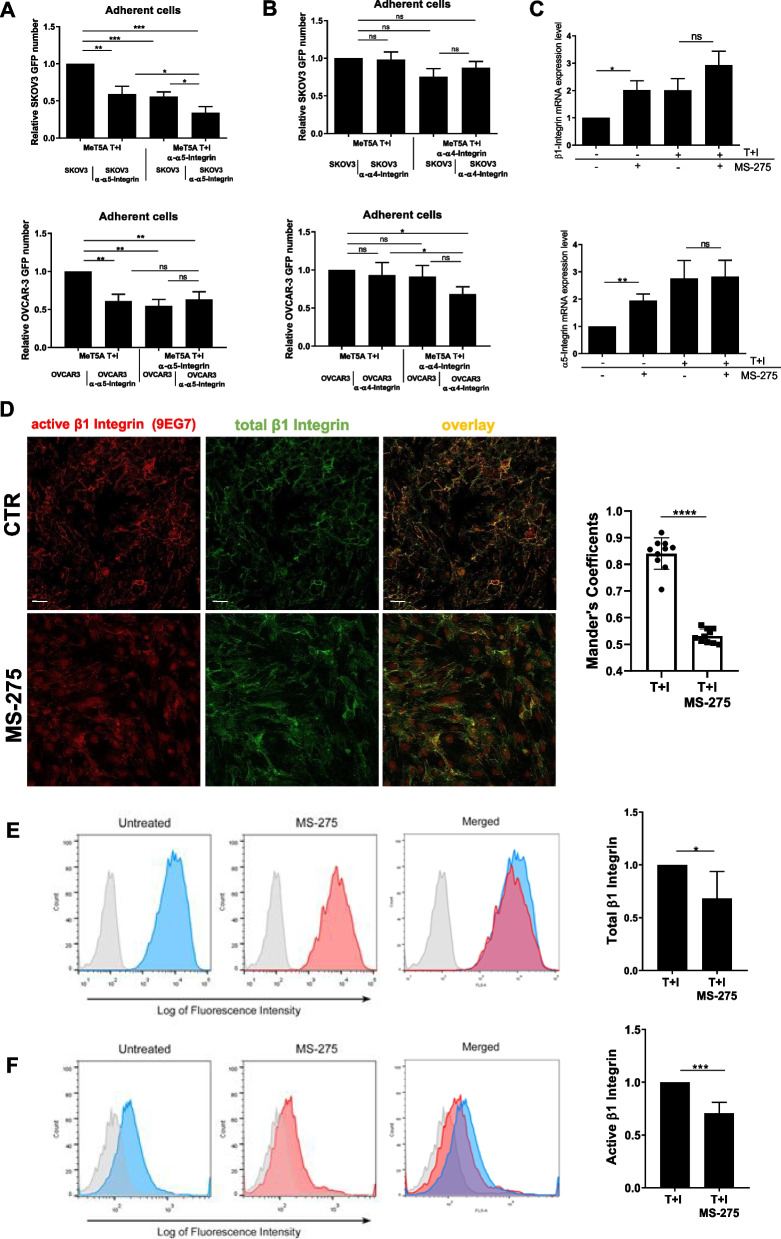
Methods: Static adhesion and peritoneal clearance experiments were performed pretreating mesenchymal-like MCs and platinum-sensitive/resistant EOC cell lines with MS-275-a Histone deacetylase (HDAC)1-3 pharmacological inhibitor currently used in combination trials. Results were acquired by confocal microscopy and were analyzed with an automated Opera software. The role of HDAC1/2 was validated by genetic silencing. The role of α4-, α5-α1 Integrins and Fibronectin-1 was validated using specific monoclonal antibodies. Quantitative proteomic analysis was performed on primary MCs pretreated with MS-275. Decellularized matrices were generated from either MS-275-exposed or untreated cells to study Fibronectin-1 extracellular secretion. The effect of MS-275 on β1 integrin activity was assessed using specific monoclonal antibodies. The role of Talin-1 in MCs/EOC adhesion was analyzed by genetic silencing. Talin-1 ectopic expression was validated as a rescue tool from MS-275-induced phenotype. The in vivo effect of MS-275-induced MC remodeling was validated in a mouse model of peritoneal EOC dissemination.

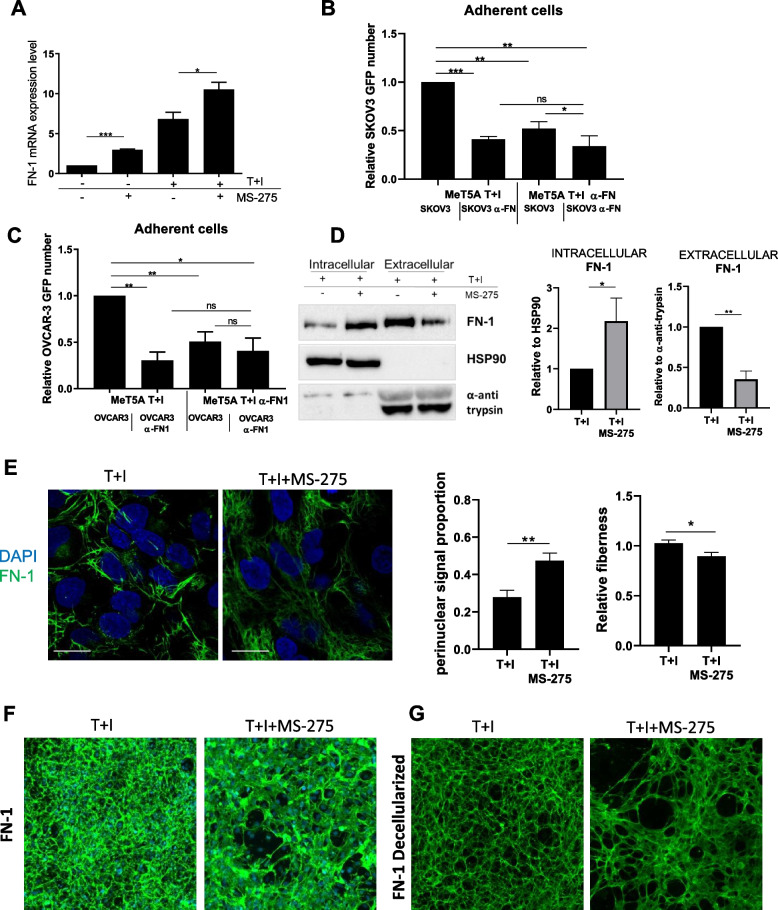
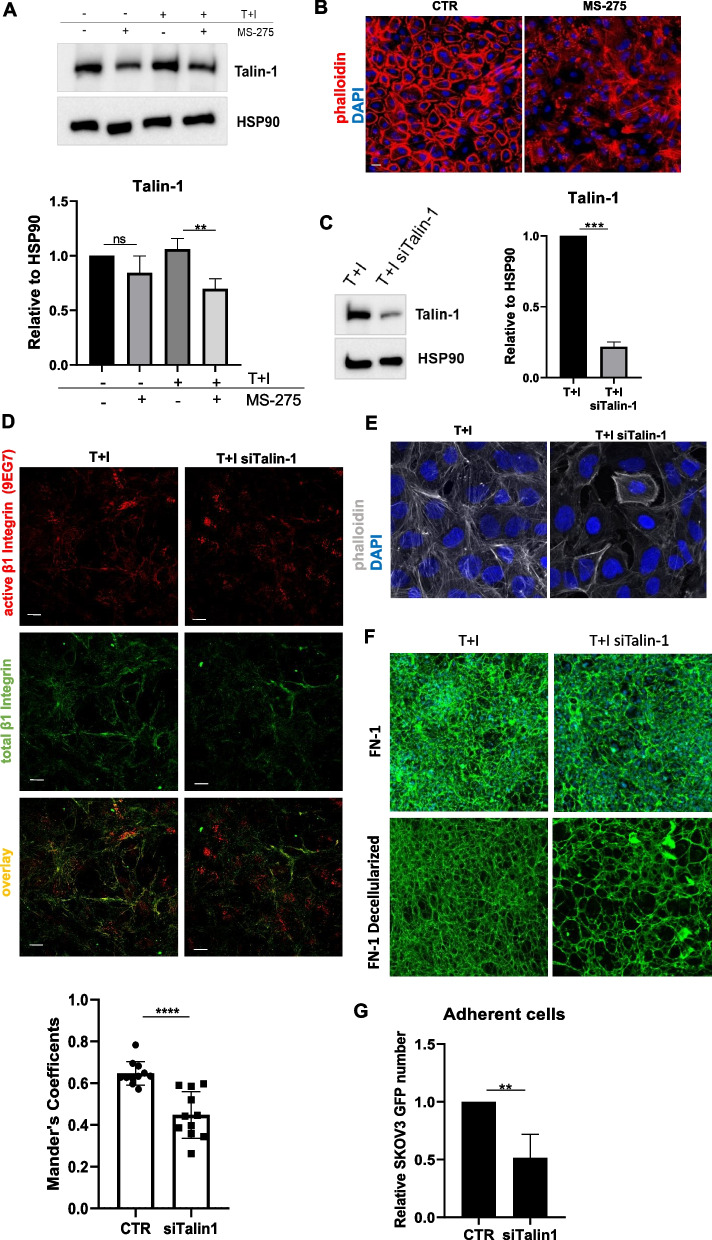
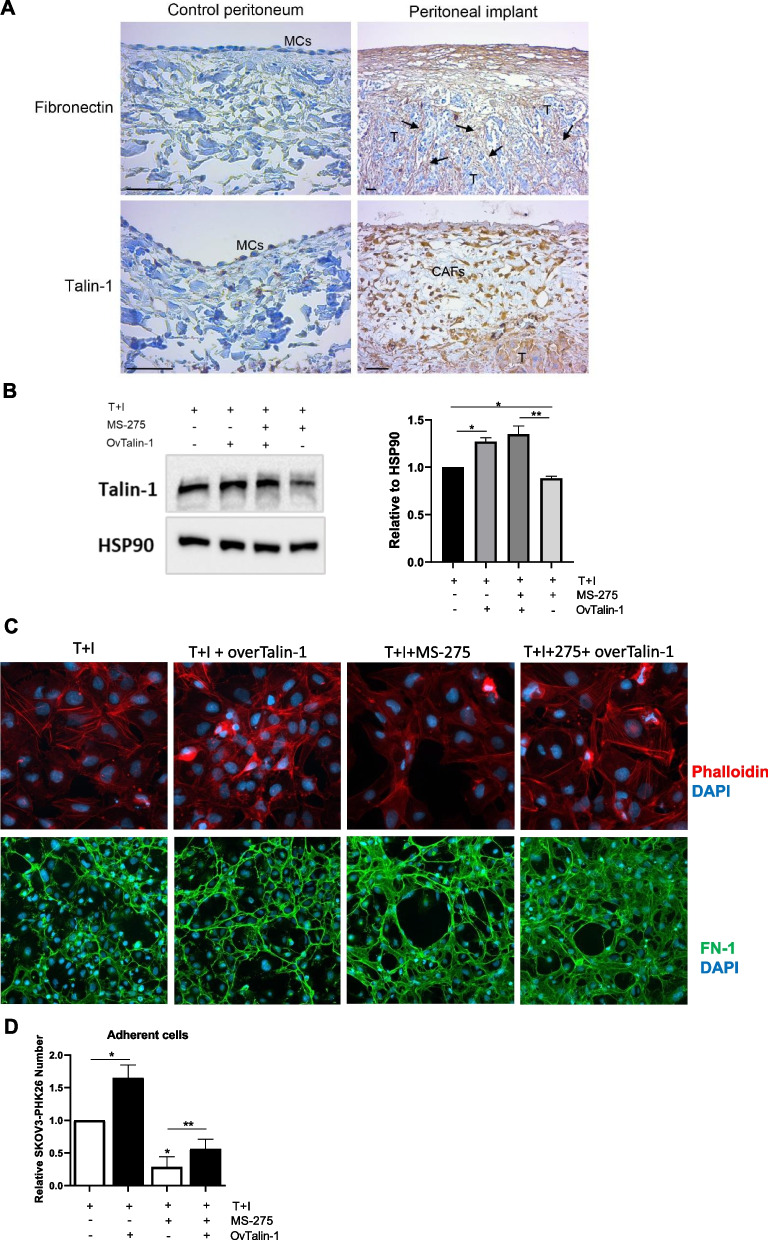
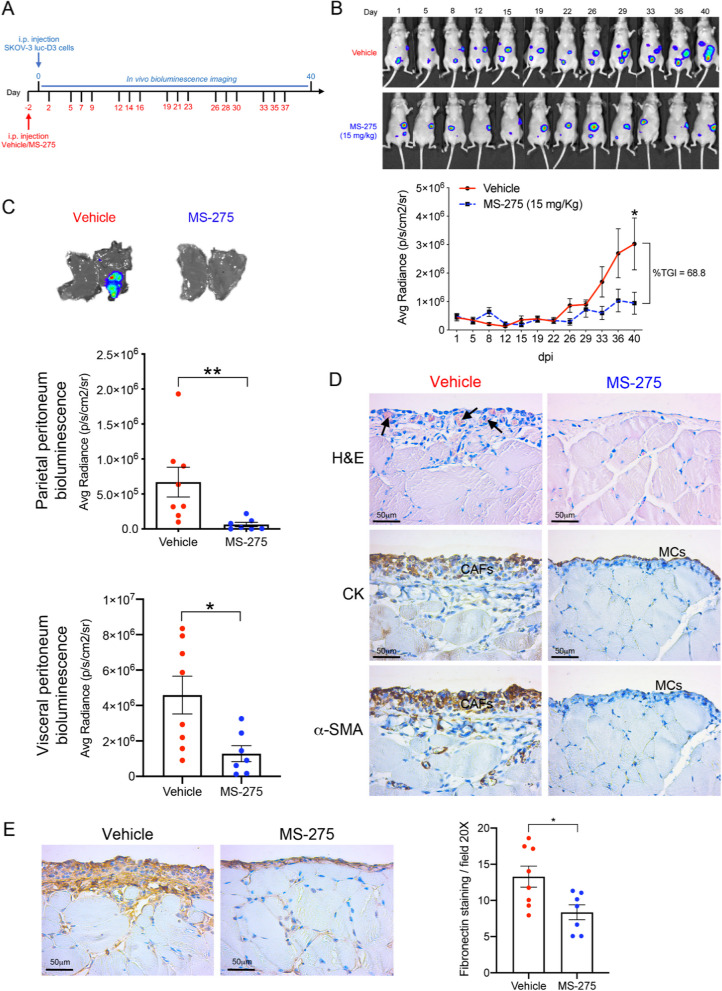
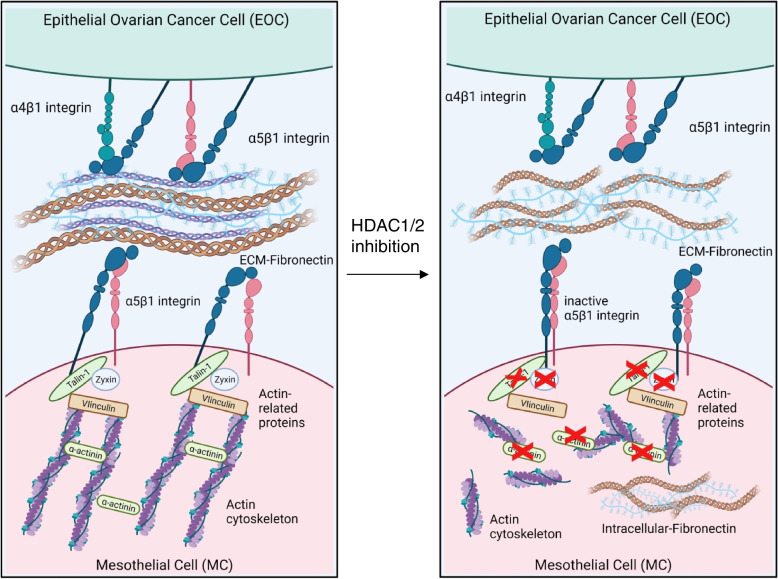
Results: Treatment of MCs with non-cytotoxic concentrations of MS-275 caused a consistent reduction of EOC adhesion. Proteomic analysis revealed several pathways altered upon MC treatment with MS-275, including ECM deposition/remodeling, adhesion receptors and actin cytoskeleton regulators. HDAC1/2 inhibition hampered actin cytoskeleton polymerization by downregulating actin regulators including Talin-1, impairing β1 integrin activation, and leading to abnormal extracellular secretion and distribution of Fibronectin-1. Talin-1 ectopic expression rescued EOC adhesion to MS-275-treated MCs. In an experimental mouse model of metastatic EOC, MS-275 limited tumor invasion, Fibronectin-1 secretion and the sub-mesothelial accumulation of MC-derived carcinoma-associated fibroblasts.

Conclusion: Our study unveils a direct impact of HDAC-1/2 in the regulation of MC/EOC adhesion and highlights the regulation of MC plasticity by epigenetic inhibition as a potential target for therapeutic intervention in EOC peritoneal metastasis.

Keywords: Actin cytoskeleton; Epithelial ovarian Cancer; Extracellular matrix; Fibronectin-1; HDAC1–2; Integrin; MS-275; Mesothelial to mesenchymal transition (MMT); Peritoneal Carcinomatosis; Peritoneum; Talin1.


Conflict of interest statement

The authors declare no competing interests.

Figures

Fig. 1
Fig. 1
EOC peritoneal metastasis biopsies show HDAC1 increased expression in MC-derived CAFs and HDAC1–2 inhibition limits mesenchymal-like MCs/EOC adhesive interactions. A left, serial sections of a control peritoneum show a conserved MC monolayer negative for HDAC1 and HDAC2. Insets show a higher magnification of the delimited areas. A Middle, serial sections of a sub-mesothelial compact zone in an EOC patient with peritoneal metastasis show areas of Podoplanin (PDPN), Fibroblast Activation Protein (FAP) and nuclear HDAC1 and HDAC2 co-localization. Right, Representative images of PDPN and FAP staining of spindle-like cells surrounding deep tumor nodules. Nuclear HDAC1 and HDAC2 staining overlap with areas of accumulation of MC-derived CAFs. Tumor cells are also HDAC1 and HDAC2 positive. Scale bar: 100 μm; CAFs: carcinoma-associated fibroblasts; T: tumor. B Representative images of GFP-labelled SKOV3 cells adhering to primary MC monolayers; C GFP-SKOV3 cells adhering to MeT5A cell monolayers; D GFP-OVCAR-3 cells adhering to MeT5A cells monolayers; E PHK26-stained Kuramochi cells adhering to MeT5A cells monolayers. Nuclei are stained with DAPI (blue). CTR: control treatment. MeT5A cells monolayers were at 100% confluence at the time of the experiment. Scale bar: 25 μm. Quantifications are shown at the right of each figure. MeT5A cells were pretreated with TGFβ1 in combination with IL-1β (T + I), and treated or not with MS-275 (250 nM) for 72 hours. Results are shown as relative number of adherent SKOV3 cells. 3 fields for each sample were analyzed. F Images of GFP-SKOV3 cells adhesion to MeT5A cells were acquired with a spinning disk automated confocal microscope and analyzed using Columbus (TM) platform considering relative tumor cells number. Results are shown as percentage of attached GFP-SKOV3 cells out of total seeded cells. G qRT-PCR showing genetic silencing of HDAC1, HDAC2 alone and HDAC1 in combination with HDAC2 from total RNA of MeT5A cells used for the experiment shown in H. Bars represent means±SEM of 3 experiments. H Adhesion assay showing adhesion of GFP-labelled SKOV3 cells to siHDAC1, siHDAC2 and siHDAC1-HDAC2 MeT5A cells. Representative images are shown on the left. Scale bar: 10 μm. Quantification of the experiment is shown on the right. Each experiment was performed at least 3 times in triplicate. Differences were considered significant at P < 0.05 (*p < 0.05; **p < 0.01; ***p < 0.001)
Fig. 2
Fig. 2
Treatment with MS-275 impacts on EOC 3D spheroid generation and on spheroid mediated peritoneal clearance (A) OVCAR-3 cells 3D spheroids were generated in the presence of MS-275 (1 μM). B SKOV3 cells 3D spheroids were generated in the presence of MS-275 (2.5 μM). Images were taken at 0, 24, 48 and 96 hours. Quantification of the area is shown at the right of the images. Cell vitality at 96 hours was analyzed by staining with Calcein AM. Representative images are shown from one experiment of 4 performed. C Images show mesothelial clearance induced by OVCAR-3 spheroids treated or not with MS-275 (1 μM) after 4 and 24 hours. The chart at the right of the images represents the ratio in percentage between the area of ​​the gap formed by the spheroid on the mesothelial monolayer (time 24 hours, labeled in yellow) and the spheroid area (time 0 hours). Representative images are shown from one experiment of 6 performed. Differences were considered significant at P < 0.05 (*p < 0.05; **p < 0.01; ***p < 0.001)
Fig. 3
Fig. 3
Treatment with MS-275 modifies the proteome of mesenchymal-like MeT5A cells. Mesenchymal-like MeT5A cells were left untreated or treated for 72 hours with MS-275 (250 nM) (N = 2). Cells were lysed with RIPA buffer and quantified by Bradford assay. Total lysates were digested and separated in 8 fractions based on proteins’ hydrophobic properties. Separated fractions were analysed by label-free liquid chromatography-mass spectrometry (nLC-MS/MS). A Principal component analysis (PCA) of the LFQ intensities obtained in NT and MS-275 treated sample datasets. B Heat map of differentially expressed proteins in NT and MS-275 samples. LFQ intensities were expressed in z-score values (range of intensity z-score: ±2.4). Up-regulated and down-regulated proteins are expressed in red and green scales respectively. Hierarchical clustering was performed using Euclidean distance and average linkage using the Perseus software. C Volcano plots comparing NT (left panel) and MS-275 (right panel) upregulated proteins. Black curves represent the significance threshold at false discovery rate (FDR) of 0.05 and S0 of 0.1. D Gene Ontology enrichment analysis performed by Perseus software on differentially expressed proteins between NT and MS-275 datasets. GOCC: Gene ontology cellular components; GOMF: Gene ontology molecular functions (E) Table showing selected identified proteins belonging to specific Gene ontology biological processes (GOBP) shown in the right column
Fig. 4
Fig. 4
Effects of MS-275 on β1 Integrin expression and activity (A-B) Adhesion assays of mesenchymal-like MeT5A pretreated with anti-Integrin α5 and -Integrin α4 blocking antibodies. Results are shown as relative number of adhered EOCs (GFP-SKOV3 cells top, GFP-OVCAR-3 cells, bottom) on the MeT5A monolayer. Adherent SKOV3 cells were analyzed in 3 fields/sample. Each experiment was performed at least 3 times in triplicate. Mesenchymal-like MeT5A cells treated with MS-275 (250 nM) for 72 hours. C RT-qPCR showing the expression of β1 and α5 Integrin subunits from total RNA of mesenchymal-like MeT5A cells treated with MS-275 (250 nM) for 72 h. Bars represent means±SEM of 5 independent experiments. D Immunofluorescence showing mesenchymal-like MeT5A cells treated with MS-275 (250 nM) for 72 hours. Fixed cells were stained with an antibody against total β1 Integrins or against active β1 Integrins (9EG7). The quantification of the experiment is shown on the right. Mander’s colocalization M2 coefficients were measured using the JACoP plugin on ImageJ. At least 10 images were quantified per experiment. Confocal images are shown from one representative experiment of three performed. Scale bar: 20 μm, E, F left, flow cytometry experiments showing the plasma membrane expression total β1 Integrin (E) and of active β1-Integrin detected using the monoclonal antibody HUTS21 (F). The fluorescence intensity profiles measured through flow cytometry depict a representative experiment. Active β1-Integrin in untreated MeT5A cells appears in blue, whereas in MS-275 treated cells (250 nM) it appears in red. Light-grey profiles depict negative controls. Right, histograms show mean fluorescence intensities (MFI) of β1 Integrin (E) and active β1 Integrin stainings (F). Bars represent means ± SEM of 5 experiments. Differences were considered significant at P < 0.05 (*p < 0.05; **p < 0.01; ***p < 0.001; **** p < 0.0001)
Fig. 5
Fig. 5
Effects of MS-275 on FN-1 expression and extracellular secretion (A) RT-qPCR experiment showing FN-1 expression from total RNA of mesenchymal-like MeT5A cells treated with MS-275 (250 nM) for 72 hours. Bars represent means±SEM of 5 experiments (B-C) Adhesion assay of GFP-SKOV3/MeT5A cells (B) and GFP-OVCAR-3/MeT5A cells (C) treated with an anti-FN-1 blocking antibody. Results are shown as relative number of adherent SKOV3 cells. 3 fields for each sample were analyzed. This experiment was performed 3 times. D Representative Western blot showing expression FN-1 from cell lysates of mesenchymal-like MeT5A cells treated as above or from cell supernatant. HSP90 and anti-anti trypsin were used as a loading control. One experiment is shown of 3 performed. Quantifications are shown in the right. E Immunofluorescence of mesenchymal-like MeT5A cells treated with MS-275. Cells were fixed, permeabilized and stained with an anti-FN-1 antibody. Nuclei are stained with DAPI (blue). Confocal images are shown from one representative experiment of four performed. Scale bar: 10 μm, Quantifications of FN-1 perinuclear proportion and fiberness are shown on the right of the figure. Differences were considered significant at P < 0.05 (*p < 0.05; **p < 0.01; ***p < 0.001; **** p < 0.0001). F, G FN-1 staining of MeT5A cells fixed and permeabilized (F) or decellularized matrices (G) after treatment with MS-275 (250 nM) for 72 h. Nuclei are stained with DAPI. Decellularized matrices are shown on the right. Representative images are shown from one of three experiments performed
Fig. 6
Fig. 6
MS-275 hampers actin cytoskeletal organization and impacts the MeT5A/SKOV3 cell adhesion by downregulating Talin-1 expression. A Representative Western blot experiment showing expression of Talin-1 from cell lysates of MeT5A cells treated MS-275 (250 nM) for 72 hours. HSP90 was used as a loading control. One of three experiments is shown. Quantification of the experiments is shown below. B Immunofluorescence of primary mesenchymal-like MCs treated with MS-275 (250 nM) for 72 hours showing the expression of Actin filaments stained with phalloidin (red). Nuclei are shown in blue (DAPI). Scale bar: 10 μm. C Western blot showing Talin-1 expression in Talin-1 silenced MeT5A cells. HSP90 was used as a loading control. One of three experiments is shown. Quantification of the experiments is shown on the right. D Immunofluorescence showing mesenchymal-like MeT5A cells stained with an antibody against active β1 Integrins (9EG7) (top) or against β1 Integrins (bottom). Mander’s colocalization M2 coefficients were measured using the JACoP plugin on ImageJ. At least 10 images were quantified per experiment. The quantification of the experiment is shown at the bottom. Confocal images are shown from one representative experiment of three performed. Scale bar: 20 μm (E) Immunofluorescence of Talin-1 silenced MeT5A cells stained with phalloidin (grey) and DAPI (blue). Scale bar: 10 μm. Representative images are shown from one of three experiments performed. F FN-1 staining of decellularized matrices of MeT5A cells treated with genetically silenced for Talin-1 for 72 hours. Nuclei are stained with DAPI. Decellularized matrices are shown on the right. Representative images are shown from one of three experiments performed. G Adhesion assays on Talin-1 silenced MeT5A cells. Results are shown as relative number of adherent GFP-SKOV3 cells on Talin-1 silenced MeT5A monolayers. Adherent SKOV3 cells were evaluated in 3 fields/sample. Bars represent the means±SEM of four experiments. Differences were considered significant at P < 0.05 (*p < 0.05; **p < 0.01; ***p < 0.001; **** p < 0.0001)
Fig. 7
Fig. 7
Talin-1 ectopic expression rescues the altered Actin polymerization, FN-1 extracellular distribution and MC/EOC adhesion upon treatment with MS-275 (A) A human control peritoneum shows a conserved MC monolayer negative for FN-1 (upper left). FN-1 (arrows) strongly stains the tumor surrounding stroma in a sample from a peritoneal carcinomatosis patient (upper right). The MC monolayer of a control peritoneal sample shows low levels of Talin-1 expression (bottom left). CAFs and tumor nodules accumulated in the sub-mesothelial compact zone of a patient sample show high staining for Talin-1 (bottom right). Scale bars: 50 𝜇m. MCs: Mesothelial cells; CAFs: carcinoma-associated fibroblasts; T: tumor. B Western blot showing ectopic expression of Talin-1 in Met5A cells treated with MS-275 (250 nM) for 72 hours. HSP90 was used as a loading control. One of three experiments is shown. Quantification of the experiment is shown on the right. C Immunofluorescence of Met5A cells treated with MS-275 (250 nM) for 72 hours where Talin-1 was ectopically expressed. Phalloidin staining to mark Actin (red) is shown in the top, FN-1 staining (green) is shown in the bottom. Nuclei were stained with DAPI. Representative images are shown from one of three experiments performed. D Adhesion assays on MeT5A cells where Talin-1 was ectopically expressed. SKOV3 cells were stained with PHK26. Results are shown as the relative number of adherent SKOV3 cells on Talin-1 ectopically expressed MeT5A monolayers. Adherent SKOV3 cells were evaluated in 3 fields/sample. Bars represent means±SEM of 3 experiments. Differences were considered significant at P < 0.05 (*p < 0.05; **p < 0.01; ***p < 0.001; **** p < 0.0001)
Fig. 8
Fig. 8
Evaluation of MS-275 treatment in a mouse model of EOC peritoneal metastasis. A In vivo experiment design. B Representative images of in vivo monitoring of SKOV3-luc-D3 cells in vehicle (n = 8) and MS-275 (n = 7) treated groups. Quantification of bioluminescence showed a significant tumor growth inhibition (TGI) in mice receiving MS-275 compared to the control group. C Representative images of parietal peritoneal tissues showing decreased tumor-emitting bioluminescence in MS-275 treated mice as compared to the vehicle group. Quantification of bioluminescence in parietal and visceral peritoneal tissues. The graph represents the mean average radiance (expressed as photons/s/cm2/sr) of SKOV3-luc-D3 cells ± SEM (*p < 0.05). D Parietal peritoneum samples were analyzed 5 weeks after i.p. injection of SKOV-luc-D3 cells. Haematoxylin & Eosin (H&E) staining shows a sub-mesothelial compact zone with accumulation of capillaries (arrows) in a vehicle mouse. A mainly conserved histological structure, without evidence of fibrosis and with a preserved MC monolayer was observed in MS-275 treated mice. Representative images of peritoneal serial sections of a mouse from the vehicle group show cytokeratin (CK) and α-SMA staining overlapping in the sub-mesothelial compact zone. Immunohistochemical analysis shows CK expression limited to the preserved mesothelium of a mouse treated with MS-275. Scale bar: 50 μm. CAFs: Carcinoma-associated fibroblasts. MCs: Mesothelial cells. E Representative images of parietal peritoneal tissues show decreased sub-mesothelial FN-1 staining in an MS-275 treated mouse (right) as compared to a control (left). Scale bar: 50 𝜇m. Right panel shows the quantification of FN-1 staining (right) (*p < 0.05)
Fig. 9
Fig. 9
Schematic representation of the effect of HDAC1/2 inhibition on MC/EOC adhesion. HDAC1/2 inhibition downregulates the expression of Talin-1 and other cytoskeletal regulators. This alters the Actin network leading to α5β1 Integrin inactivation and impairing FN-1 secretion and eventually inhibiting MC/EOC adhesion

References

    1. Sung H, Ferlay J, Siegel RL, Laversanne M, Soerjomataram I, Jemal A, et al. Global Cancer statistics 2020: GLOBOCAN estimates of incidence and mortality worldwide for 36 cancers in 185 countries. CA Cancer J Clin. 2021;71(3):209–249. doi: 10.3322/caac.21660. - DOI - PubMed
    1. Ozols RF, Bundy BN, Greer BE, Fowler JM, Clarke-Pearson D, Burger RA, et al. Phase III trial of carboplatin and paclitaxel compared with cisplatin and paclitaxel in patients with optimally resected stage III ovarian cancer: a gynecologic oncology group study. J Clin Oncol. 2003;21(17):3194–3200. doi: 10.1200/JCO.2003.02.153. - DOI - PubMed
    1. Hennessy BT, Coleman RL, Markman M. Ovarian cancer. Lancet. 2009;374(9698):1371–1382. doi: 10.1016/S0140-6736(09)61338-6. - DOI - PubMed
    1. Jacobs IJ, Menon U, Ryan A, Gentry-Maharaj A, Burnell M, Kalsi JK, et al. Ovarian cancer screening and mortality in the UK collaborative trial of ovarian Cancer screening (UKCTOCS): a randomised controlled trial. Lancet. 2016;387(10022):945–956. doi: 10.1016/S0140-6736(15)01224-6. - DOI - PMC - PubMed
    1. Tan DS, Agarwal R, Kaye SB. Mechanisms of transcoelomic metastasis in ovarian cancer. Lancet Oncol. 2006;7(11):925–934. doi: 10.1016/S1470-2045(06)70939-1. - DOI - PubMed

MeSH terms