

A novel lipid metabolism-based risk model associated with immunosuppressive mechanisms in diffuse large B-cell lymphoma
- PMID: 38254162
- PMCID: PMC10801940
- DOI: 10.1186/s12944-024-02017-z
A novel lipid metabolism-based risk model associated with immunosuppressive mechanisms in diffuse large B-cell lymphoma
Abstract
Background: The molecular diversity exhibited by diffuse large B-cell lymphoma (DLBCL) is a significant obstacle facing current precision therapies. However, scoring using the International Prognostic Index (IPI) is inadequate when fully predicting the development of DLBCL. Reprogramming lipid metabolism is crucial for DLBCL carcinogenesis and expansion, while a predictive approach derived from lipid metabolism-associated genes (LMAGs) has not yet been recognized for DLBCL.
Methods: Gene expression profiles of DLBCL were generated using the Gene Expression Omnibus (GEO) and The Cancer Genome Atlas (TCGA) databases. The LASSO Cox regression was used to construct an effective predictive risk-scoring model for DLBCL patients. The Kaplan-Meier survival assessment was employed to compare a given risk score with the IPI score and its impact on the survival of DLBCL patients. Functional enrichment examination was performed utilizing the KEGG pathway. After identifying hub genes via single-sample GSEA (ssGSEA), immunohistochemical staining and immunofluorescence were performed on lymph node samples from control and DLBCL patients to confirm these identified genes.
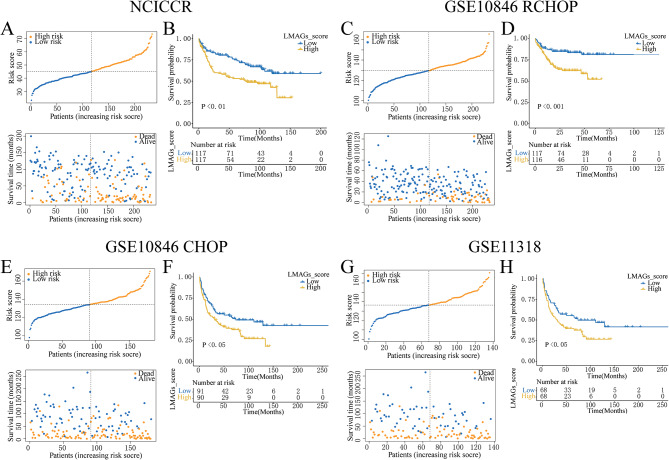
Results: Sixteen lipid metabolism- and survival-associated genes were identified to construct a prognostic risk-scoring approach. This model demonstrated robust performance over various datasets and emerged as an autonomous risk factor for predicting the development of DLBCL patients. The risk score could significantly distinguish the development of DLBCL patients from the low-risk and elevated-risk IPI classes. Results from the inhibitory immune-related pathways and lower immune scores suggested an immunosuppressive phenotype within the elevated-risk group. Three hub genes, MECR, ARSK, and RAN, were identified to be negatively correlated with activated CD8 T cells and natural killer T cells in the elevated-risk score class. Ultimately, it was determined that these three genes were expressed by lymphoma cells but not by T cells in clinical samples from DLBCL patients.
Conclusion: The risk level model derived from 16 lipid metabolism-associated genes represents a prognostic biomarker for DLBCL that is novel, robust, and may have an immunosuppressive role. It can compensate for the limitations of the IPI score in predicting overall survival and has potential clinical application value.
Keywords: Diffuse large b-cell lymphoma; Immune infiltration; Lipid metabolism; Prognosis.
© 2024. The Author(s).
Conflict of interest statement
The authors declare that they have no competing interests.
Figures


Similar articles
-
Lipid metabolism-related gene signature predicts prognosis and unveils novel anti-tumor drugs in specific type of diffuse large B cell lymphoma.Mol Med. 2024 Nov 13;30(1):210. doi: 10.1186/s10020-024-00988-4. Mol Med. 2024. PMID: 39538125 Free PMC article.
-
Identification of molecular subtypes and a novel prognostic model of diffuse large B-cell lymphoma based on a metabolism-associated gene signature.J Transl Med. 2022 Apr 25;20(1):186. doi: 10.1186/s12967-022-03393-9. J Transl Med. 2022. PMID: 35468826 Free PMC article.
-
Identifying CD1c as a potential biomarker by the comprehensive exploration of tumor mutational burden and immune infiltration in diffuse large B cell lymphoma.PeerJ. 2023 Dec 11;11:e16618. doi: 10.7717/peerj.16618. eCollection 2023. PeerJ. 2023. PMID: 38099311 Free PMC article.
-
Development of a mitochondria-related gene signature for prognostic assessment in diffuse large B cell lymphoma.Front Oncol. 2025 Mar 20;15:1542829. doi: 10.3389/fonc.2025.1542829. eCollection 2025. Front Oncol. 2025. PMID: 40182032 Free PMC article.
-
CCL8 as a promising prognostic factor in diffuse large B-cell lymphoma via M2 macrophage interactions: A bioinformatic analysis of the tumor microenvironment.Front Immunol. 2022 Aug 22;13:950213. doi: 10.3389/fimmu.2022.950213. eCollection 2022. Front Immunol. 2022. PMID: 36072582 Free PMC article.
Cited by
-
Regulation and therapy: the role of ferroptosis in DLBCL.Front Pharmacol. 2025 Jan 6;15:1458412. doi: 10.3389/fphar.2024.1458412. eCollection 2024. Front Pharmacol. 2025. PMID: 39834804 Free PMC article. Review.
-
MicroRNAs in Diffuse Large B-Cell Lymphoma (DLBCL): Biomarkers with Prognostic Potential.Cancers (Basel). 2025 Apr 12;17(8):1300. doi: 10.3390/cancers17081300. Cancers (Basel). 2025. PMID: 40282476 Free PMC article.
-
Tumor Microenvironment, Inflammation, and Inflammatory Prognostic Indices in Diffuse Large B-Cell Lymphomas: A Narrative Review.Int J Mol Sci. 2025 Jun 13;26(12):5670. doi: 10.3390/ijms26125670. Int J Mol Sci. 2025. PMID: 40565133 Free PMC article. Review.
-
Analyzing the involvement of diverse cell death-related genes in diffuse large B-cell lymphoma using bioinformatics techniques.Heliyon. 2024 May 7;10(10):e30831. doi: 10.1016/j.heliyon.2024.e30831. eCollection 2024 May 30. Heliyon. 2024. PMID: 38779021 Free PMC article.
-
Upregulation of stomatin is associated with poor prognosis and promotes tumor progression of orbital diffuse large B-cell lymphoma.Front Oncol. 2025 May 23;15:1596614. doi: 10.3389/fonc.2025.1596614. eCollection 2025. Front Oncol. 2025. PMID: 40485728 Free PMC article.
References
-
- Flowers CR, Sinha R, Vose JM. Improving outcomes for patients with diffuse large B-cell lymphoma. CA Cancer J Clin. 2010;60(6):393–408. - PubMed
-
- Chapuy B, Stewart C, Dunford AJ, Kim J, Kamburov A, Redd RA, Lawrence MS, Roemer MGM, Li AJ, Ziepert M, et al. Molecular subtypes of diffuse large B cell lymphoma are associated with distinct pathogenic mechanisms and outcomes. Nat Med. 2018;24(5):679–90. doi: 10.1038/s41591-018-0016-8. - DOI - PMC - PubMed
MeSH terms
Grants and funding
LinkOut - more resources
Full Text Sources
Research Materials
Miscellaneous
