. 2024 Jan 22;26(1):32.
doi: 10.1186/s13075-023-03259-5.

PD-1 signaling uncovers a pathogenic subset of T cells in inflammatory arthritis

Affiliations

PD-1 signaling uncovers a pathogenic subset of T cells in inflammatory arthritis

Johanna Straube et al. Arthritis Res Ther. .

Abstract

Background: PD-1 is an immune checkpoint on T cells, and interventions to block this receptor result in T cell activation and enhanced immune response to tumors and pathogens. Reciprocally, despite a decade of research, approaches to treat autoimmunity with PD-1 agonists have only had limited successful. To resolve this, new methods must be developed to augment PD-1 function beyond engaging the receptor.

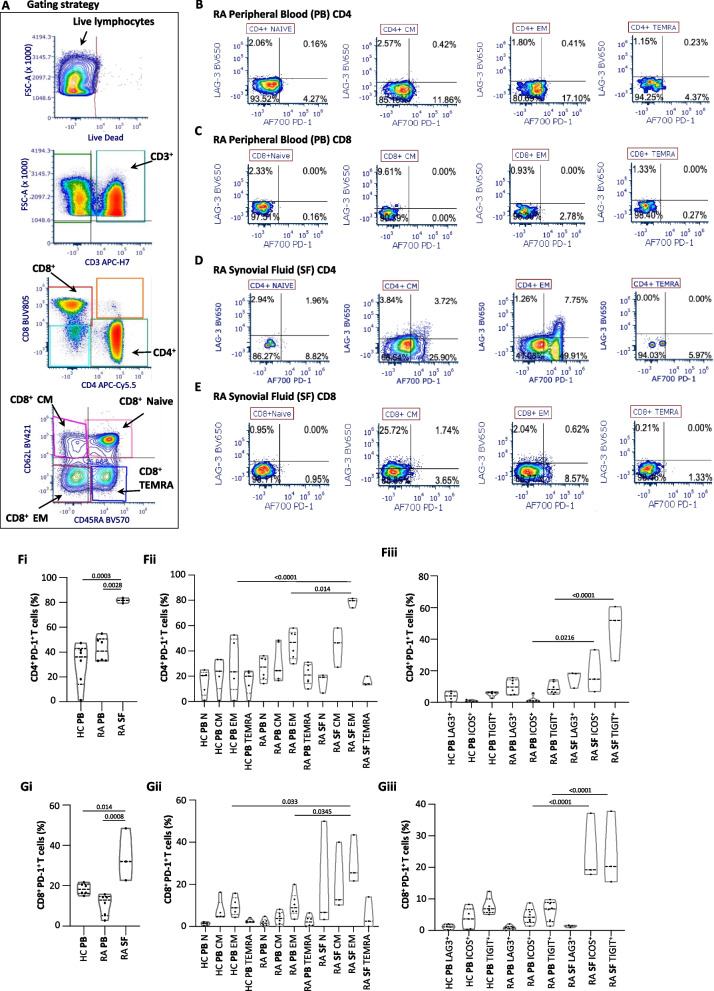
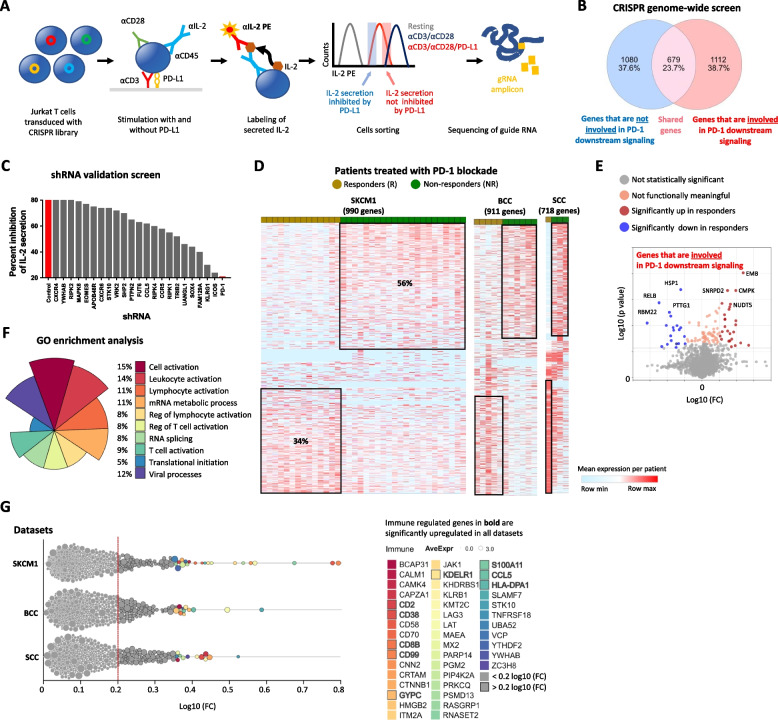
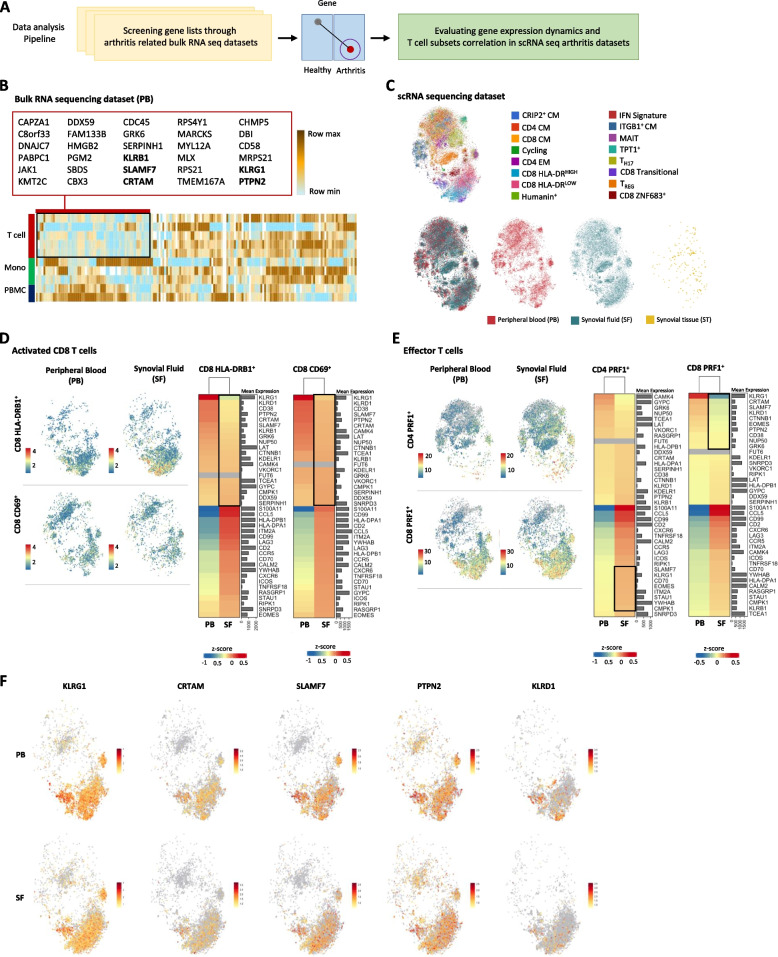
Methods: We conducted a flow cytometry analysis of T cells isolated from the peripheral blood and synovial fluid of patients with rheumatoid arthritis. In addition, we performed a genome-wide CRISPR/Cas9 screen to identify genes associated with PD-1 signaling. We further analyzed genes involved in PD-1 signaling using publicly available bulk and single-cell RNA sequencing datasets.

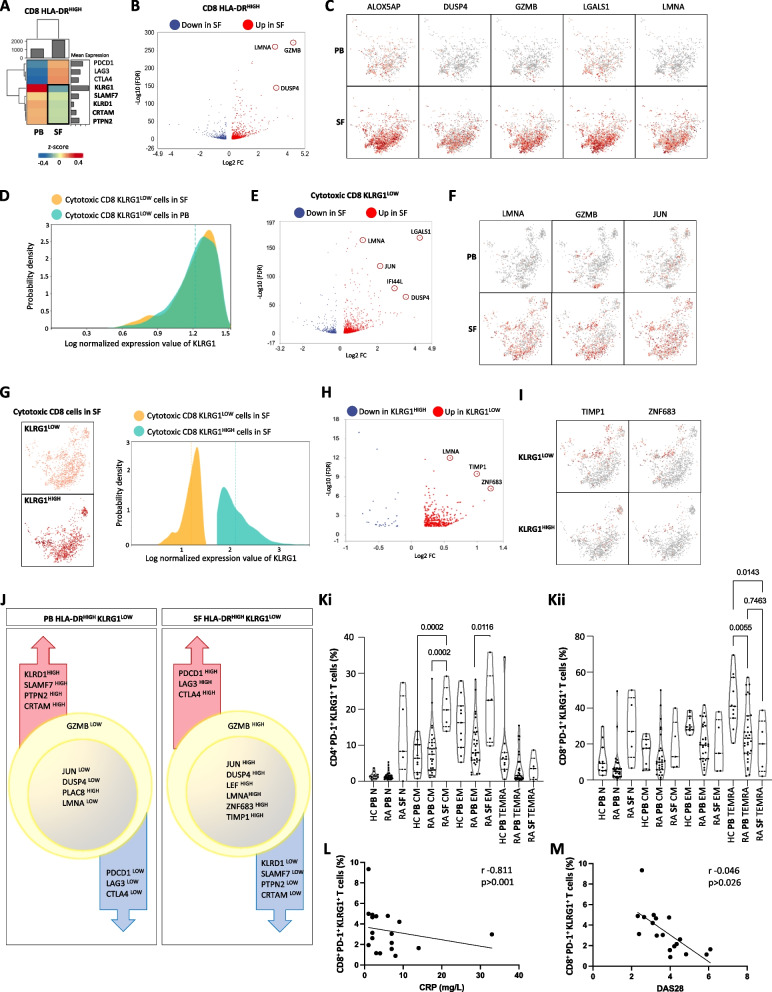
Results: Our screen confirmed known regulators in proximal PD-1 signaling and, importantly, identified an additional 1112 unique genes related to PD-1 ability to inhibit T cell functions. These genes were strongly associated with the response of cancer patients to PD-1 blockades and with high tumor immune dysfunction and exclusion scores, confirming their role downstream of PD-1. Functional annotation revealed that the most significant genes uncovered were those associated with known immune regulation processes. Remarkably, these genes were considerably downregulated in T cells isolated from patients with inflammatory arthritis, supporting their overall inhibitory functions. A study of rheumatoid arthritis single-cell RNA sequencing data demonstrated that five genes, KLRG1, CRTAM, SLAMF7, PTPN2, and KLRD1, were downregulated in activated and effector T cells isolated from synovial fluids. Backgating these genes to canonical cytotoxic T cell signatures revealed PD-1+ HLA-DRHIGH KLRG1LOW T cells as a novel inflammatory subset of T cells.

Conclusions: We concluded that PD-1+ HLA-DRHIGH KLRG1LOW T cells are a potential target for future PD-1 agonists to treat inflammatory diseases. Our study uncovers new genes associated with PD-1 downstream functions and, therefore, provides a comprehensive resource for additional studies that are much needed to characterize the role of PD-1 in the synovial subset of T cells.

Keywords: Inflammatory arthritis; KLRG1; PD-1 agonist; Synovial fluid; T cells.


Conflict of interest statement

The authors declare no competing interests.

Figures

Fig. 1
Fig. 1
PD-1 levels in synovial T cells are higher than in peripheral blood T cells. Gating strategy for different T cell subsets (A). Flow cytometry was performed on T cells isolated from synovial fluid (SF) and matched peripheral blood (PB) T cells from patients with rheumatoid arthritis (RA) (B–E). Flow cytometry analysis of the expression levels of PD-1 and LAG-3 was performed on naïve (N), central memory (CM), effector memory (EM), terminally differentiated memory cells (TEMR) CD4, and CD8 T cells (B–E). Violin plots quantification of the percentages of CD4+PD-1+ cells in healthy controls (HC) PB, RA PB, and RA SF out of all CD4+ cells (Fi). Violin plots quantification of the percentages of CD4+PD-1+ cells in HC PB, RA PB, and RA SF out of all CD4+ cells within N, CM, EM, and TEMRA subsets (Fii). Violin plots quantification of the percentages of CD4+PD-1+ cells expressing LAG3, ICOS, or TIGIT in HC PB, RA PB, and RA SF out of all CD4+PD-1+ cells (Fiii). Violin plot quantification of the percentages of CD8+PD-1+ cells in healthy controls HC PB, RA PB, and RA SF out of all CD8+ cells (Gi). Violin plot quantification of the percentages of CD8+PD-1+ cells in HC PB, RA PB, and RA SF out of all CD8+ cells within N, CM, EM, and TEMRA subsets (Gii). Violin plot quantification of the percentages of CD8+PD-1+ cells expressing LAG3, ICOS, or TIGIT in HC PB, RA PB, and RA SF out of all CD8+PD-1.+ cells (Giii). Statistical significance was determined using ordinary 1-way ANOVA, Tukey’s multiple comparisons test; *p < 0.05, n = 3–5
Fig. 2
Fig. 2
The expression of genes required for PD-1 signaling is associated with clinical response to PD-1 blockade. Diagram of the experimental pipeline from transduction of the Jurkat T cells, cell labeling, stimulation, sorting, and guide sequencing (A). Venn diagram showing the number of genes identified by sequencing in the two groups of sorted cells (B). Graph showing the levels of secreted IL-2 measured in each clone of Jurkat short hairpin knockdown T cells under the indicated treatment conditions, n = 4 for each cell line; average values are shown (C). Heatmaps showing the differential expression levels of genes that we discovered in our screen to be involved in PD-1 downstream signaling, now in T cells isolated from cancer patients that were treated with anti-PD-1 antibodies in three separated clinical trials (SKCM1, BCC, SCC) (D). The patients were divided into those who responded favorably to PD-1 blockade (R) and those who failed to respond (NR). Volcano plots display expression levels of genes that were either upregulated or downregulated in the cancer patients who failed to respond to PD-1 blockade (E). Differences in the expression levels were calculated by implementing Limma statistics. GO-enrichment analysis of the genes identified in the screen and involved in the PD-1 signaling pathway (F). A berswarm plot expression levels of genes discovered in the screen and as differentially expressed in the T cell from the cancer patients subjected to PD-1 blockade (G). Bolded genes are those that were shared in all three clinical trials
Fig. 3
Fig. 3
Genes that are associated with PD-1 signaling are downregulated in inflammatory arthritis. The schematic of the data analysis pipeline shows the transition from the investigation of bulk RNA sequencing data to single-cell RNA sequencing data of patients with inflammatory arthritis (A). Heatmap showing RNA expression levels of top genes of bulk RNA sequencing datasets of RA patients sorted based on highest TIDE scoring (B). Highlighted in the box are downregulated genes, specifically in the T cells of RA patients. Genes in bold letters were also significantly downregulated in subsequent analysis. UMAP plot showing clusters reannotation of single-cell RNA sequencing data of RA patients, prioritizing the genes emphasized in B (C). Cells were clustered based on the T cell subset and by anatomical origin: PB, SF, or synovial tissue (ST). UMAP plots comparing the distribution of two clusters of activated CD8 T cells, CD8 HLA-DRB1+ and CD8 CD69+, isolated from either PB or SF (D). The expression of genes significantly differentially expressed in the two subsets of activated CD8 T cells is PB compared to SF. UMAP plots comparing the distribution of effector CD4 T cells (CD4 PRF1+) to effector CD T cells (CD4 PRF1.+) (E). Expression of genes significantly differentially expressed between the CD4 PRF1 + and the CD8 PRF1 + effector subset in the PB and SF compartments. UMAP plots showing cell subsets expressing high levels of KLRG1, CRTAM, SLAMF7, PTPN2, and KLRD1 (F)
Fig. 4
Fig. 4
Identification of a population of pathogenic PD-1HIGH KLRG1LOW T cells in synovial fluid. Heatmap showing differential RNA expression levels of selected genes between PB and SF within the CD8 HLA-DRHIGH T cells (A). Volcano plot showing genes that were up- or downregulated in SF HLA-DRHIGH cells (B). UMAP plots show the enriched population of cells expressing the genes upregulated in SF CD8 HLA-DRHIGH T cells, now compared to PB CD8 HLA-DRHIGH T cells (C). Density plot comparing the distribution of the expression levels of KLRG1 in cytotoxic CD8 KLRG1LOW cells from SF and PB (D). Volcano plot displaying up- or downregulated genes in SF cytotoxic CD8 KLRG1LOW cells (E). UMAP plots show the enriched population of cells expressing the genes upregulated in SF cytotoxic CD8 KLRG1LOW SF compared to PB (F). UMAP plot and density plot showing the populations and the spectrum of expression of KLRG1 in SF cytotoxic CD8 KLRG1LOW and SF cytotoxic CD8 KLRG1HIGH cells (G). Volcano plot displaying genes downregulated in cytotoxic CD8 KLRG1HIGH cells and upregulated in cytotoxic CD8 KLRG1LOW in SF (H). UMAP plots show the enriched population of cells expressing TIMP1 and ZNF683 in cytotoxic CD8 KLRG1LOW and cytotoxic CD8 KLRG1HIGH SF cells (I). Diagram showing the distinctive genes up- or downregulated in HLA-DRHIGH KLRG1LOW T cells from PB and SF (J). Violin plots summarizing the percentages of CD4+PD-1+KLRG+ T cells isolated from HC PB, RA PB, and RA SF samples and gated on N, CD, EM, and TEMRA subsets (Ki). Violin plots summarizing the percentages of CD8+PD-1+KLRG1+ T cell isolated from HC PB, RA PB, and RA SF samples and gated on N, CD, EM, and TEMRA subsets (Kii). Pearson correlation analysis between the percentages of CD8+PD-1+KLRG1.+ T cells and CRP (L) and DAS28 (M). Statistical significance was determined using ordinary 1-way ANOVA, post hoc test applying Šidák’s multiple comparisons; * p < 0.05, n = 5–30

Update of

Similar articles

Cited by

References

    1. Ribas A, Wolchok JD. Cancer immunotherapy using checkpoint blockade. Science. 2018;359(6382):1350–1355. doi: 10.1126/science.aar4060. - DOI - PMC - PubMed
    1. Jubel JM, Barbati ZR, Burger C, Wirtz DC, Schildberg FA. The Role of PD-1 in Acute and Chronic Infection. Front Immunol. 2020;24(11):487. doi: 10.3389/fimmu.2020.00487. - DOI - PMC - PubMed
    1. Patsoukis N, Wang Q, Strauss L, Boussiotis VA. Revisiting the PD-1 pathway. Sci Adv. 2020;6(38):eabd2712. doi: 10.1126/sciadv.abd2712. - DOI - PMC - PubMed
    1. Riella LV, Paterson AM, Sharpe AH, Chandraker A. Role of the PD-1 pathway in the immune response. Am J Transplant. 2012;12(10):2575–2587. doi: 10.1111/j.1600-6143.2012.04224. - DOI - PMC - PubMed
    1. Shiravand Y, Khodadadi F, Kashani SMA, Hosseini-Fard SR, Hosseini S, Sadeghirad H, Ladwa R, O'Byrne K, Kulasinghe A. Immune Checkpoint Inhibitors in Cancer Therapy. Curr Oncol. 2022;29(5):3044–3060. doi: 10.3390/curroncol29050247. - DOI - PMC - PubMed

Publication types

Substances