

Metagenomics reveals the temporal dynamics of the rumen resistome and microbiome in goat kids
- PMID: 38254181
- PMCID: PMC10801991
- DOI: 10.1186/s40168-023-01733-5
Metagenomics reveals the temporal dynamics of the rumen resistome and microbiome in goat kids
Abstract
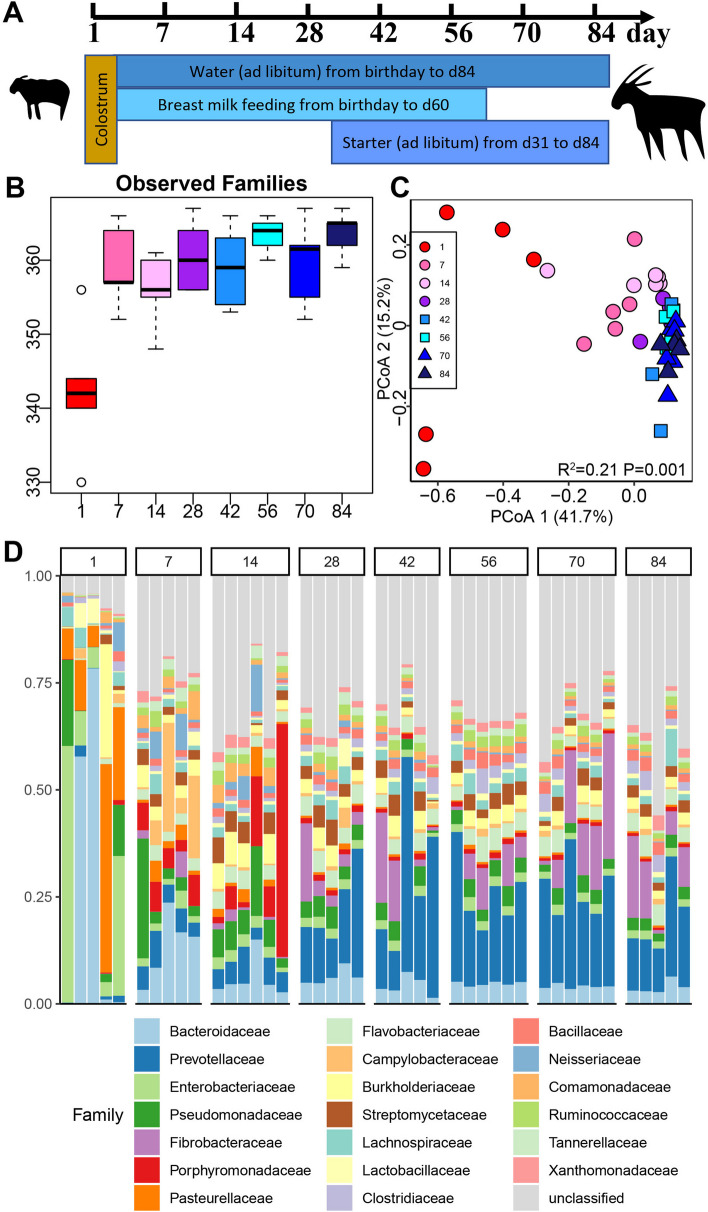
Background: The gut microbiome of domestic animals carries antibiotic resistance genes (ARGs) which can be transmitted to the environment and humans, resulting in challenges of antibiotic resistance. Although it has been reported that the rumen microbiome of ruminants may be a reservoir of ARGs, the factors affecting the temporal dynamics of the rumen resistome are still unclear. Here, we collected rumen content samples of goats at 1, 7, 14, 28, 42, 56, 70, and 84 days of age, analyzed their microbiome and resistome profiles using metagenomics, and assessed the temporal dynamics of the rumen resistome in goats at the early stage of life under a conventional feeding system.
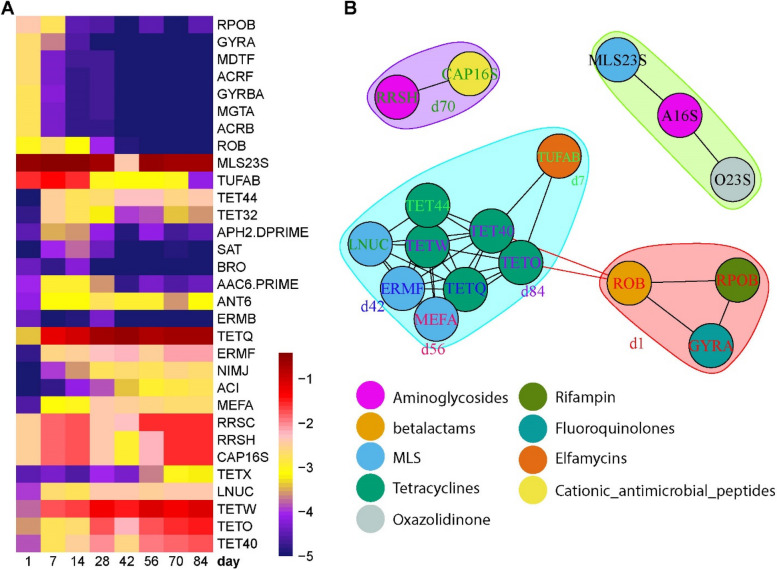
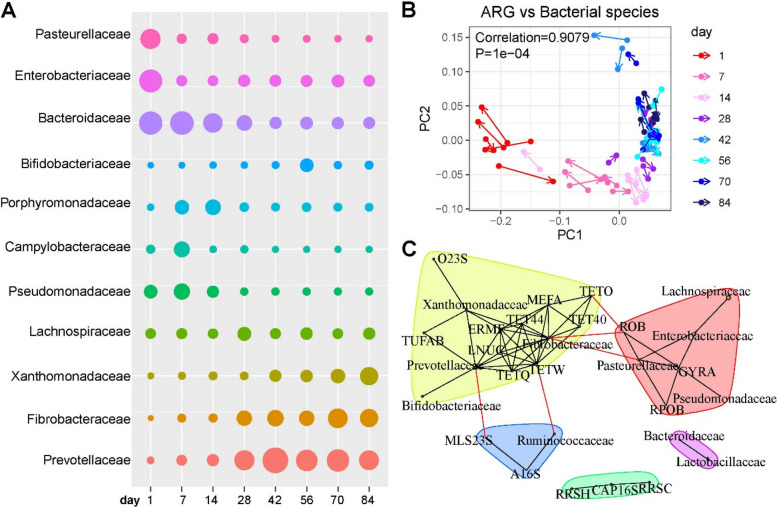
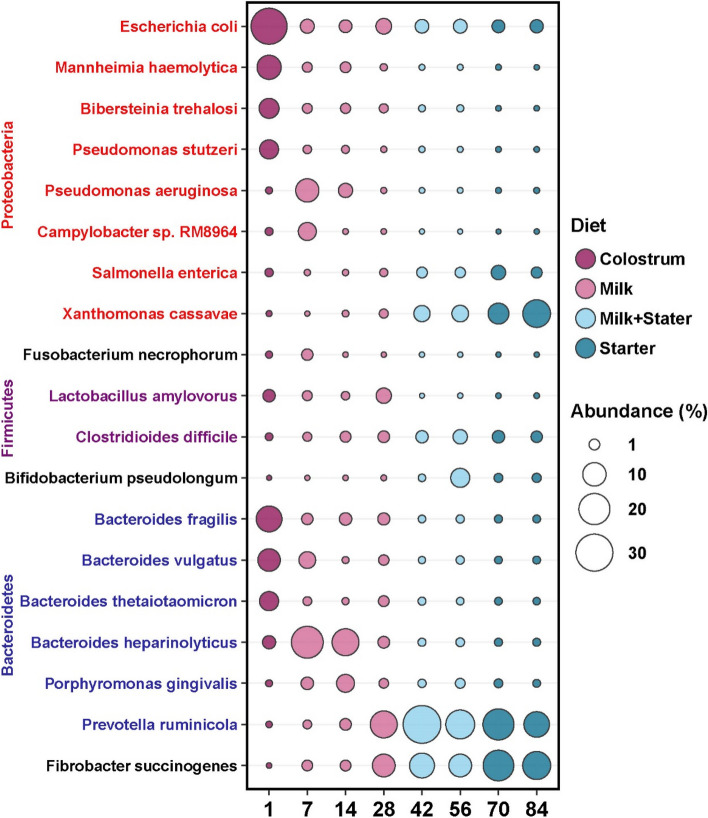
Results: In our results, the rumen resistome of goat kids contained ARGs to 41 classes, and the richness of ARGs decreased with age. Four antibiotic compound types of ARGs, including drugs, biocides, metals, and multi-compounds, were found during milk feeding, while only drug types of ARGs were observed after supplementation with starter feed. The specific ARGs for each age and their temporal dynamics were characterized, and the network inference model revealed that the interactions among ARGs were related to age. A strong correlation between the profiles of rumen resistome and microbiome was found using Procrustes analysis. Ruminal Escherichia coli within Proteobacteria phylum was the main carrier of ARGs in goats consuming colostrum, while Prevotella ruminicola and Fibrobacter succinogenes associated with cellulose degradation were the carriers of ARGs after starter supplementation. Milk consumption was likely a source of rumen ARGs, and the changes in the rumen resistome with age were correlated with the microbiome modulation by starter supplementation.
Conclusions: Our data revealed that the temporal dynamics of the rumen resistome are associated with the microbiome, and the reservoir of ARGs in the rumen during early life is likely related to age and diet. It may be a feasible strategy to reduce the rumen and its downstream dissemination of ARGs in ruminants through early-life dietary intervention. Video Abstract.
Keywords: Ages; Diet; Horizontal transfer; Metagenomics; Microbiome; Rumen resistome; Ruminants; Temporal dynamics.
© 2024. The Author(s).
Conflict of interest statement
The authors declare that they have no competing interests.
Figures


Similar articles
-
Feeding systems influence the rumen resistome in yaks by changing the microbiome.Front Microbiol. 2025 Mar 19;16:1505938. doi: 10.3389/fmicb.2025.1505938. eCollection 2025. Front Microbiol. 2025. PMID: 40177486 Free PMC article.
-
Expressions of resistome is linked to the key functions and stability of active rumen microbiome.Anim Microbiome. 2022 Jun 4;4(1):38. doi: 10.1186/s42523-022-00189-6. Anim Microbiome. 2022. PMID: 35659381 Free PMC article.
-
Ruminal resistome of dairy cattle is individualized and the resistotypes are associated with milking traits.Anim Microbiome. 2021 Feb 10;3(1):18. doi: 10.1186/s42523-021-00081-9. Anim Microbiome. 2021. PMID: 33568223 Free PMC article.
-
Good microbes, bad genes? The dissemination of antimicrobial resistance in the human microbiome.Gut Microbes. 2022 Jan-Dec;14(1):2055944. doi: 10.1080/19490976.2022.2055944. Gut Microbes. 2022. PMID: 35332832 Free PMC article. Review.
-
Antimicrobial Resistance Genes (ARGs), the Gut Microbiome, and Infant Nutrition.Nutrients. 2023 Jul 18;15(14):3177. doi: 10.3390/nu15143177. Nutrients. 2023. PMID: 37513595 Free PMC article. Review.
Cited by
-
High-Throughput Sequencing Analysis Revealed a Preference for Animal-Based Food in Purple Sea Urchins.Biology (Basel). 2024 Aug 15;13(8):623. doi: 10.3390/biology13080623. Biology (Basel). 2024. PMID: 39194561 Free PMC article.
-
Deterministic succession patterns in the rumen and fecal microbiome associate with host metabolic shifts in peripartum dairy cattle.Gigascience. 2025 Jan 6;14:giaf042. doi: 10.1093/gigascience/giaf042. Gigascience. 2025. PMID: 40388308 Free PMC article.
-
Editorial: The gut-skin axis: interaction of gut microbiome and skin diseases.Front Microbiol. 2024 Jun 4;15:1427770. doi: 10.3389/fmicb.2024.1427770. eCollection 2024. Front Microbiol. 2024. PMID: 38894969 Free PMC article. No abstract available.
-
Seven hundred and ninety-seven metagenome-assembled genomes from the goat rumen during early life.Sci Data. 2024 Aug 17;11(1):897. doi: 10.1038/s41597-024-03703-4. Sci Data. 2024. PMID: 39154041 Free PMC article.
-
Exploration of mobile genetic elements in the ruminal microbiome of Nellore cattle.Sci Rep. 2024 Jun 6;14(1):13056. doi: 10.1038/s41598-024-63951-7. Sci Rep. 2024. PMID: 38844487 Free PMC article.
References
-
- Hudson JA, Frewer LJ, Jones G, Brereton PA, Whittingham MJ, Stewart G. The agri-food chain and antimicrobial resistance: a review. Trends Food Sci Tech. 2017;69131–147. 10.1016/j.tifs.2017.09.007
Publication types
MeSH terms
Substances
Grants and funding
LinkOut - more resources
Full Text Sources
