

Plasma metabolic profiles predict future dementia and dementia subtypes: a prospective analysis of 274,160 participants
- PMID: 38254212
- PMCID: PMC10802055
- DOI: 10.1186/s13195-023-01379-3
Plasma metabolic profiles predict future dementia and dementia subtypes: a prospective analysis of 274,160 participants
Abstract
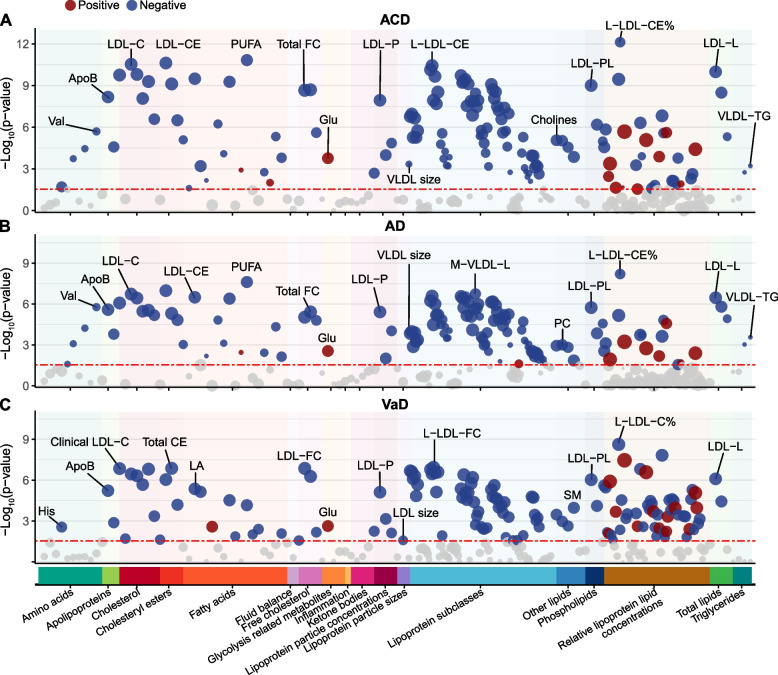
Background: Blood-based biomarkers for dementia are gaining attention due to their non-invasive nature and feasibility in regular healthcare settings. Here, we explored the associations between 249 metabolites with all-cause dementia (ACD), Alzheimer's disease (AD), and vascular dementia (VaD) and assessed their predictive potential.
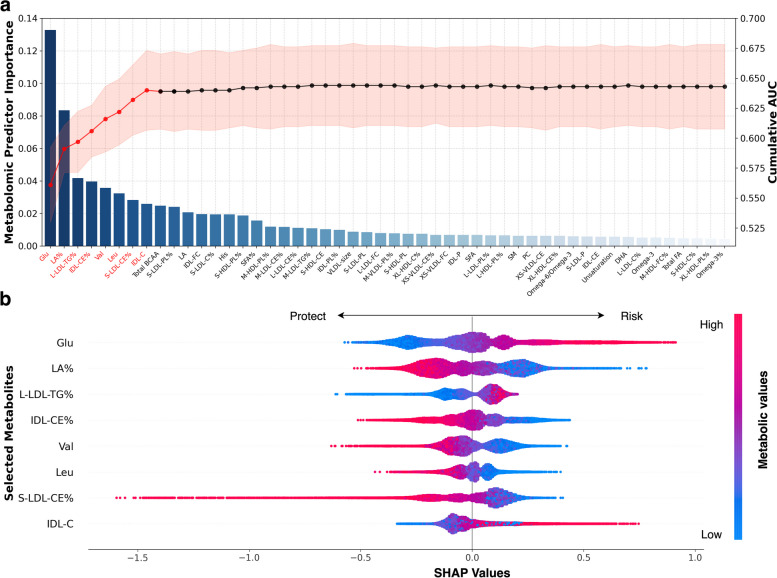
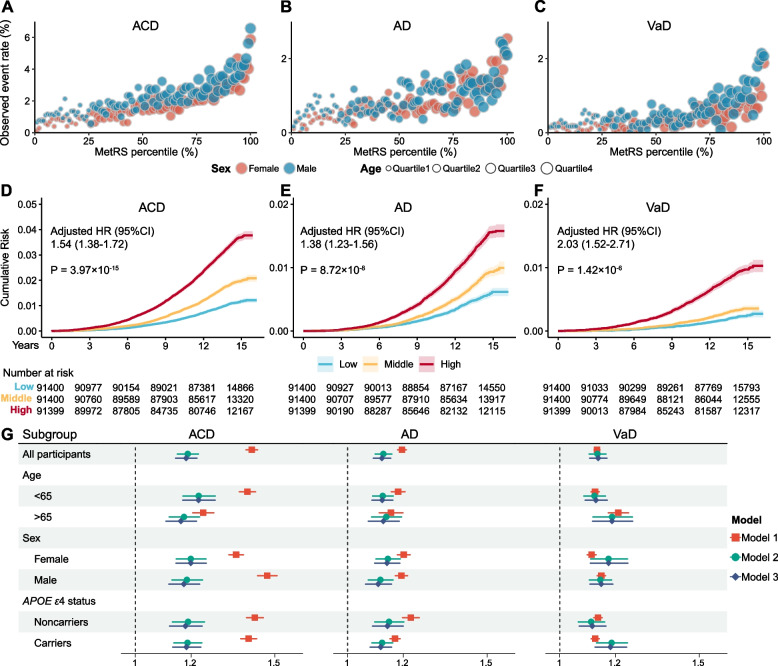
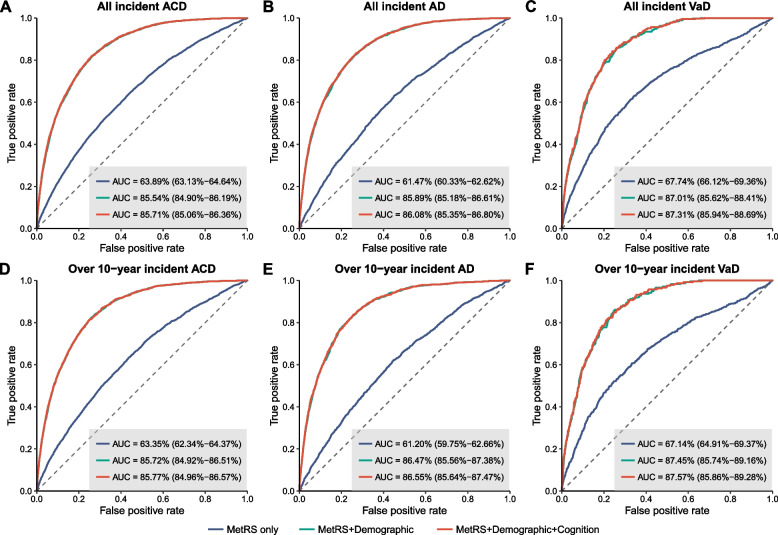
Methods: This study included 274,160 participants from the UK Biobank. Cox proportional hazard models were employed to investigate longitudinal associations between metabolites and dementia. The importance of these metabolites was quantified using machine learning algorithms, and a metabolic risk score (MetRS) was subsequently developed for each dementia type. We further investigated how MetRS stratified the risk of dementia onset and assessed its predictive performance, both alone and in combination with demographic and cognitive predictors.
Results: During a median follow-up of 14.01 years, 5274 participants developed dementia. Of the 249 metabolites examined, 143 were significantly associated with incident ACD, 130 with AD, and 140 with VaD. Among metabolites significantly associated with dementia, lipoprotein lipid concentrations, linoleic acid, sphingomyelin, glucose, and branched-chain amino acids ranked top in importance. Individuals within the top tertile of MetRS faced a significantly greater risk of developing dementia than those in the lowest tertile. When MetRS was combined with demographic and cognitive predictors, the model yielded the area under the receiver operating characteristic curve (AUC) values of 0.857 for ACD, 0.861 for AD, and 0.873 for VaD.
Conclusions: We conducted the largest metabolome investigation of dementia to date, for the first time revealed the metabolite importance ranking, and highlighted the contribution of plasma metabolites for dementia prediction.
Keywords: Alzheimer’s disease; Dementia; Metabolomics; Plasma; Prediction; Vascular dementia.
© 2024. The Author(s).
Conflict of interest statement
The authors declare no competing interests.
Figures
References
-
- Chang R, Trushina E, Zhu K, Zaidi SSA, Lau BM, Kueider-Paisley A, et al. Predictive metabolic networks reveal sex- and APOE genotype-specific metabolic signatures and drivers for precision medicine in Alzheimer’s disease. Alzheimers Dementia. 2023;19:518–531. doi: 10.1002/alz.12675. - DOI - PMC - PubMed
-
- Liu J, Amin N, Sproviero W, Arnold M, Batra R, Bonnechere B, et al. Longitudinal analysis of UK Biobank participants suggests age and APOE-dependent alterations of energy metabolism in development of dementia. Neurology; 2022 Feb. Available from: http://medrxiv.org/lookup/doi/10.1101/2022.02.25.22271530
Publication types
MeSH terms
Grants and funding
- 2018SHZDZX01/Shanghai Municipal Science and Technology Major Project
- 2018SHZDZX01/Shanghai Municipal Science and Technology Major Project
- 2018YFC1312904, 2019YFA0709502/National Key R&D Program of China
- B18015/111 Project
- 21QA1408700/Shanghai Rising-Star Program
- 82071997/National Natural Sciences Foundation of China
- 2022ZD0211600/Science and Technology Innovation 2030 Major Projects
- 2022QD002/Research Start-up Fund of Huashan Hospital
- 3030277001/Excellence 2025 Talent Cultivation Program at Fudan University
- 2019074/Shanghai Talent Development Funding for The Project
- 82071201, 81971032, 92249305/National Natural Science Foundation of China
LinkOut - more resources
Full Text Sources
Medical
