. 2024 Jan 22;25(1):28.
doi: 10.1186/s13059-023-03152-z.

SURGE: uncovering context-specific genetic-regulation of gene expression from single-cell RNA sequencing using latent-factor models

Affiliations

SURGE: uncovering context-specific genetic-regulation of gene expression from single-cell RNA sequencing using latent-factor models

Benjamin J Strober et al. Genome Biol. .

Abstract

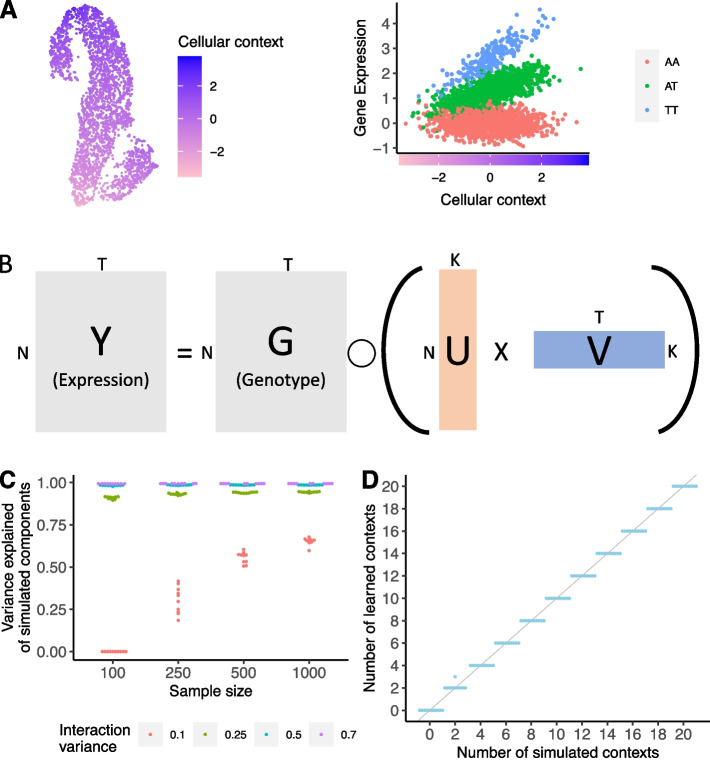
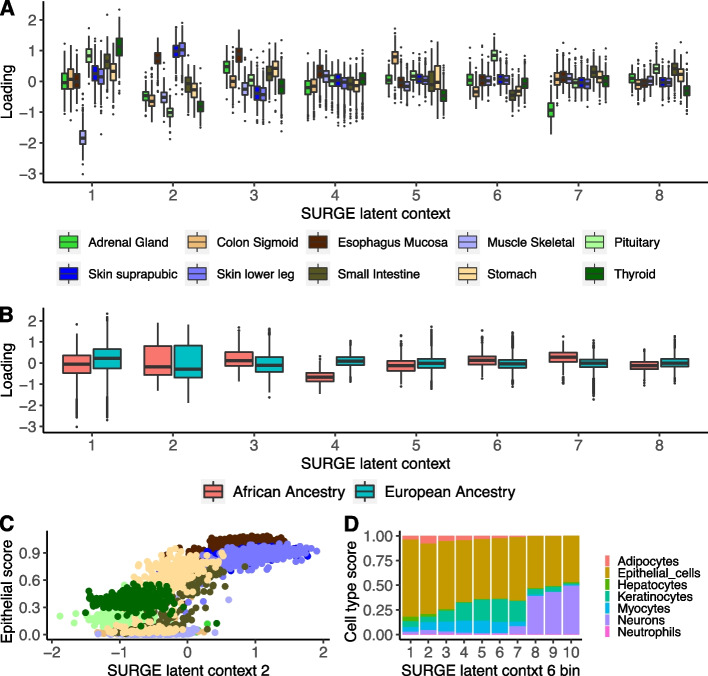
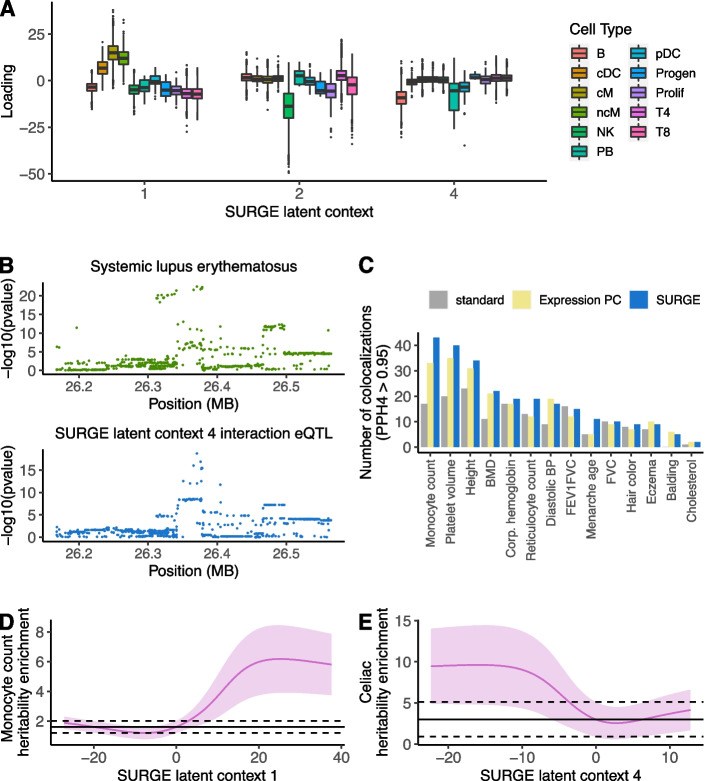
Genetic regulation of gene expression is a complex process, with genetic effects known to vary across cellular contexts such as cell types and environmental conditions. We developed SURGE, a method for unsupervised discovery of context-specific expression quantitative trait loci (eQTLs) from single-cell transcriptomic data. This allows discovery of the contexts or cell types modulating genetic regulation without prior knowledge. Applied to peripheral blood single-cell eQTL data, SURGE contexts capture continuous representations of distinct cell types and groupings of biologically related cell types. We demonstrate the disease-relevance of SURGE context-specific eQTLs using colocalization analysis and stratified LD-score regression.

Keywords: Single-cell transcriptomics; eQTL.


Conflict of interest statement

AB is a shareholder of Alphabet, Inc., and a consultant for Third Rock Ventures.

Figures

Fig. 1
Fig. 1
SURGE model overview and simulation. A Schematic example of an interaction eQTL where the eQTL effect size (right) changes as a function of cellular context (depicted in UMAP embedding, left). B SURGE is a novel probabilistic model that uses matrix factorization to jointly learn a continuous representation of the cellular contexts defining each measurement (U) and the corresponding eQTL effect sizes specific to each learned context (V) based on observed expression (Y) and genotype (G) data. SURGE additional accounts for the effects of known covariates and sample repeat structure on gene expression (not shown in figure; see the “Methods” section). Assume there are N samples, T genome-wide independent variant-gene pairs, and K latent contexts. C Based on simulated data, we evaluated SURGE’s ability to reconstruct simulated latent contexts as measured by the average variance explained of the simulated latent contexts by the learned latent contexts (y-axis). We simulate 5 latent contexts and vary the sample size (x-axis) and the strength (variance; see the “Methods” section) of the interaction terms (colors). We fix the fraction of tests that are context-specific eQTLs for each context to .3 (see the “Methods” section). For each parameter setting, we run 10 independent simulations. Each dot is an independent simulation. D Based on simulated data, we evaluate SURGE’s ability to identify the number of simulated latent contexts across 10 independent simulations. The sample size was fixed to 250, the strength (variance) of the simulated interaction terms was fixed to .25, and the fraction of tests that are context-specific eQTLs for a particular context (see the “Methods” section) was fixed to .3. For each parameter setting, we run 10 independent simulations. Each dot is an independent simulation
Fig. 2
Fig. 2
SURGE applied to GTEx v8 bulk RNA-seq samples. A, B SURGE latent context loadings of GTEx v8 RNA-seq samples (y-axis) stratified by A known tissue identity and B known ancestry for top 8 inferred SURGE latent contexts. C Scatter plot of SURGE latent context 2 loadings (x-axis) and xCell Epithelial cell type enrichment score (y-axis) for GTEx v8 RNA-seq samples colored by known tissue identity (same color palette as A). D GTEx v8 RNA-seq samples are separated into 10 quantile bins according to their value on SURGE latent context 6. The stacked bar plot depicts the average xCell cell type enrichment scores across all samples normalized to sum to 1 (y-axis) in each of the 10 bins (x-axis)
Fig. 3
Fig. 3
SURGE applied to PBMC single-cell eQTL data. A SURGE latent context loadings of pseudocells (y-axis) stratified by cell type (color) according to marker gene expression profiles for each of the SURGE latent context 1, 2, and 4 (x-axis). B Colocalization between SURGE latent context 4 interaction eQTL variant chr6:26370572:C:T for BTN3A2 and GWAS signal for SLE. C Number of colocalizations identified (PPH4 > .95; y-axis) between various 14 independent GWAS studies (x-axis) and eQTLs identified from pseudocells. The number of colocalizations using standard eQTLs shown in grey, the number of unique colocalizations using expression PC interaction eQTLs aggregated across the top 6 expression PC shown in yellow, and the number of unique colocalizations using SURGE interaction eQTLs, aggregated across the 6 SURGE latent contexts, shown in blue. D, E S-LDSC enrichment (y-axis) of squared standard eQTL effect sizes (black line) and SURGE predicted squared eQTL effect size at a specific SURGE latent context value (pink line at a specific x-axis position) within D monocyte count and E celiac disease heritability. SURGE predicted eQTL effect sizes at a particular SURGE latent context value was calculated at 200 equally spaced positions along the range of SURGE latent context values. Black dashed line represents 95% confidence on the standard eQTL S-LDSC enrichment. Light pink region depicts 95% confidence on the SURGE predicted eQTL S-LDSC enrichment

References

    1. Nica AC, Dermitzakis ET. Expression quantitative trait loci: present and future. Philos Trans R Soc Lond B Biol Sci. 2013;368:20120362. doi: 10.1098/rstb.2012.0362. - DOI - PMC - PubMed
    1. Lappalainen T, The Geuvadis Consortium. Sammeth M, Friedländer MR, ‘tHoen PAC, Monlong J, et al. Transcriptome and genome sequencing uncovers functional variation in humans. Nature. 2013;501:506–511. doi: 10.1038/nature12531. - DOI - PMC - PubMed
    1. Battle A, Mostafavi S, Zhu X, Potash JB, Weissman MM, McCormick C, et al. Characterizing the genetic basis of transcriptome diversity through RNA-sequencing of 922 individuals. Genome Res. 2014;24:14–24. doi: 10.1101/gr.155192.113. - DOI - PMC - PubMed
    1. Kerimov N, Hayhurst JD, Peikova K, Manning JR, Walter P, Kolberg L, et al. A compendium of uniformly processed human gene expression and splicing quantitative trait loci. Nat Genet. 2021;53:1290–1299. doi: 10.1038/s41588-021-00924-w. - DOI - PMC - PubMed
    1. The GTEx Consortium The GTEx Consortium atlas of genetic regulatory effects across human tissues. Science. 2020;369:1318–1330. doi: 10.1126/science.aaz1776. - DOI - PMC - PubMed

Publication types