

Gut microbial ecology and exposome of a healthy Pakistani cohort
- PMID: 38254227
- PMCID: PMC10801943
- DOI: 10.1186/s13099-024-00596-x
Gut microbial ecology and exposome of a healthy Pakistani cohort
Abstract
Background: Pakistan is a multi-ethnic society where there is a disparity between dietary habits, genetic composition, and environmental exposures. The microbial ecology of healthy Pakistani gut in the context of anthropometric, sociodemographic, and dietary patterns holds interest by virtue of it being one of the most populous countries, and also being a Lower Middle Income Country (LMIC).
Methods: 16S rRNA profiling of healthy gut microbiome of normo-weight healthy Pakistani individuals from different regions of residence is performed with additional meta-data collected through filled questionnaires. The current health status is then linked to dietary patterns through [Formula: see text] test of independence and Generalized Linear Latent Variable Model (GLLVM) where distribution of individual microbes is regressed against all recorded sources of variability. To identify the core microbiome signature, a dynamic approach is used that considers into account species occupancy as well as consistency across assumed grouping of samples including organization by gender and province of residence. Fitting neutral modeling then revealed core microbiome that is selected by the environment.
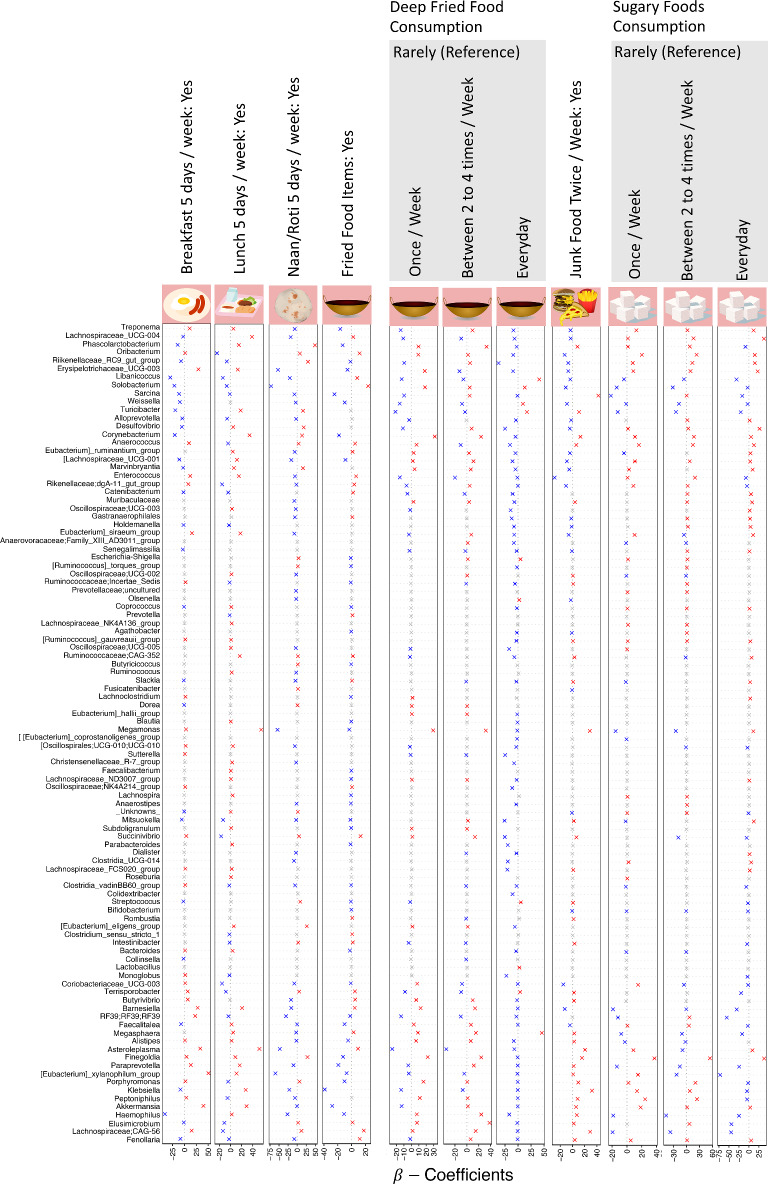
Results: A strong determinant of disparity is by province of residence. It is also established that the male microbiome is better adapted to the local niche than the female microbiome, and that there is microbial taxonomic and functional diversity in different ethnicities, dietary patterns and lifestyle habits. Some microbial genera, such as, Megamonas, Porphyromonas, Haemophilus, Klebsiella and Finegoldia showed significant associations with consumption of pickle, fresh fruits, rice, and cheese. Our analyses suggest current health status being associated with the diet, sleeping patterns, employment status, and the medical history.
Conclusions: This study provides a snapshot of the healthy core Pakistani gut microbiome by focusing on the most populous provinces and ethnic groups residing in predominantly urban areas. The study serves a reference dataset for exploring variations in disease status and designing personalized dietary and lifestyle interventions to promote gut health, particularly in LMICs settings.
© 2024. The Author(s).
Conflict of interest statement
The authors declare that they have no competing interests.
Figures


Similar articles
-
Gut microbial ecology and function of a Pakistani cohort with Iron deficiency Anemia.Sci Rep. 2025 May 20;15(1):17532. doi: 10.1038/s41598-025-02556-0. Sci Rep. 2025. PMID: 40394206 Free PMC article.
-
Impact of urbanization on gut microbiome mosaics across geographic and dietary contexts.mSystems. 2024 Oct 22;9(10):e0058524. doi: 10.1128/msystems.00585-24. Epub 2024 Sep 17. mSystems. 2024. PMID: 39287374 Free PMC article.
-
Mycobacterium avium subspecies paratuberculosis (MAP) infection, and its impact on gut microbiome of individuals with multiple sclerosis.Sci Rep. 2024 Oct 14;14(1):24027. doi: 10.1038/s41598-024-74975-4. Sci Rep. 2024. PMID: 39402079 Free PMC article.
-
Dietary glycation compounds - implications for human health.Crit Rev Toxicol. 2024 Sep;54(8):485-617. doi: 10.1080/10408444.2024.2362985. Epub 2024 Aug 16. Crit Rev Toxicol. 2024. PMID: 39150724
-
Could Artificial Intelligence/Machine Learning and Inclusion of Diet-Gut Microbiome Interactions Improve Disease Risk Prediction? Case Study: Coronary Artery Disease.Front Microbiol. 2022 Apr 11;13:627892. doi: 10.3389/fmicb.2022.627892. eCollection 2022. Front Microbiol. 2022. PMID: 35479632 Free PMC article. Review.
Cited by
-
Effect of Fluoride on Gut Microbiota: A Systematic Review.Nutr Rev. 2025 Jul 1;83(7):e1853-e1880. doi: 10.1093/nutrit/nuae202. Nutr Rev. 2025. PMID: 40063073 Free PMC article.
-
Bacteriophages from treatment-naïve type 2 diabetes individuals drive an inflammatory response in human co-cultures of dendritic cells and T cells.Gut Microbes. 2024 Jan-Dec;16(1):2380747. doi: 10.1080/19490976.2024.2380747. Epub 2024 Jul 27. Gut Microbes. 2024. PMID: 39068518 Free PMC article.
-
Specialty grand challenge: how can we use integrative approaches to understand microbial community dynamics?Front Syst Biol. 2024 Jun 17;4:1432791. doi: 10.3389/fsysb.2024.1432791. eCollection 2024. Front Syst Biol. 2024. PMID: 40809114 Free PMC article. No abstract available.
References
-
- Wang B, Yao M, Lv L, Ling Z, Li L. The human microbiota in health and disease. Engineering. 2017;3(1):71–82. doi: 10.1016/J.ENG.2017.01.008. - DOI
Grants and funding
LinkOut - more resources
Full Text Sources
