

The Effects of Signal to Noise Ratio, T60 , Wide-Dynamic Range Compression Speed, and Digital Noise Reduction in a Virtual Restaurant Setting
- PMID: 38254265
- PMCID: PMC11141238
- DOI: 10.1097/AUD.0000000000001469
The Effects of Signal to Noise Ratio, T60 , Wide-Dynamic Range Compression Speed, and Digital Noise Reduction in a Virtual Restaurant Setting
Abstract
Objectives: Hearing aid processing in realistic listening environments is difficult to study effectively. Often the environment is unpredictable or unknown, such as in wearable aid trials with subjective report by the wearer. Some laboratory experiments create listening environments to exert tight experimental control, but those environments are often limited by physical space, a small number of sound sources, or room absorptive properties. Simulation techniques bridge this gap by providing greater experimental control over listening environments, effectively bringing aspects of the real-world into the laboratory. This project used simulation to study the effects of wide-dynamic range compression (WDRC) and digital noise reduction (DNR) on speech intelligibility in a reverberant environment with six spatialized competing talkers. The primary objective of this study was to determine the efficacy of WDRC and DNR in a complex listening environment using virtual auditory space techniques.
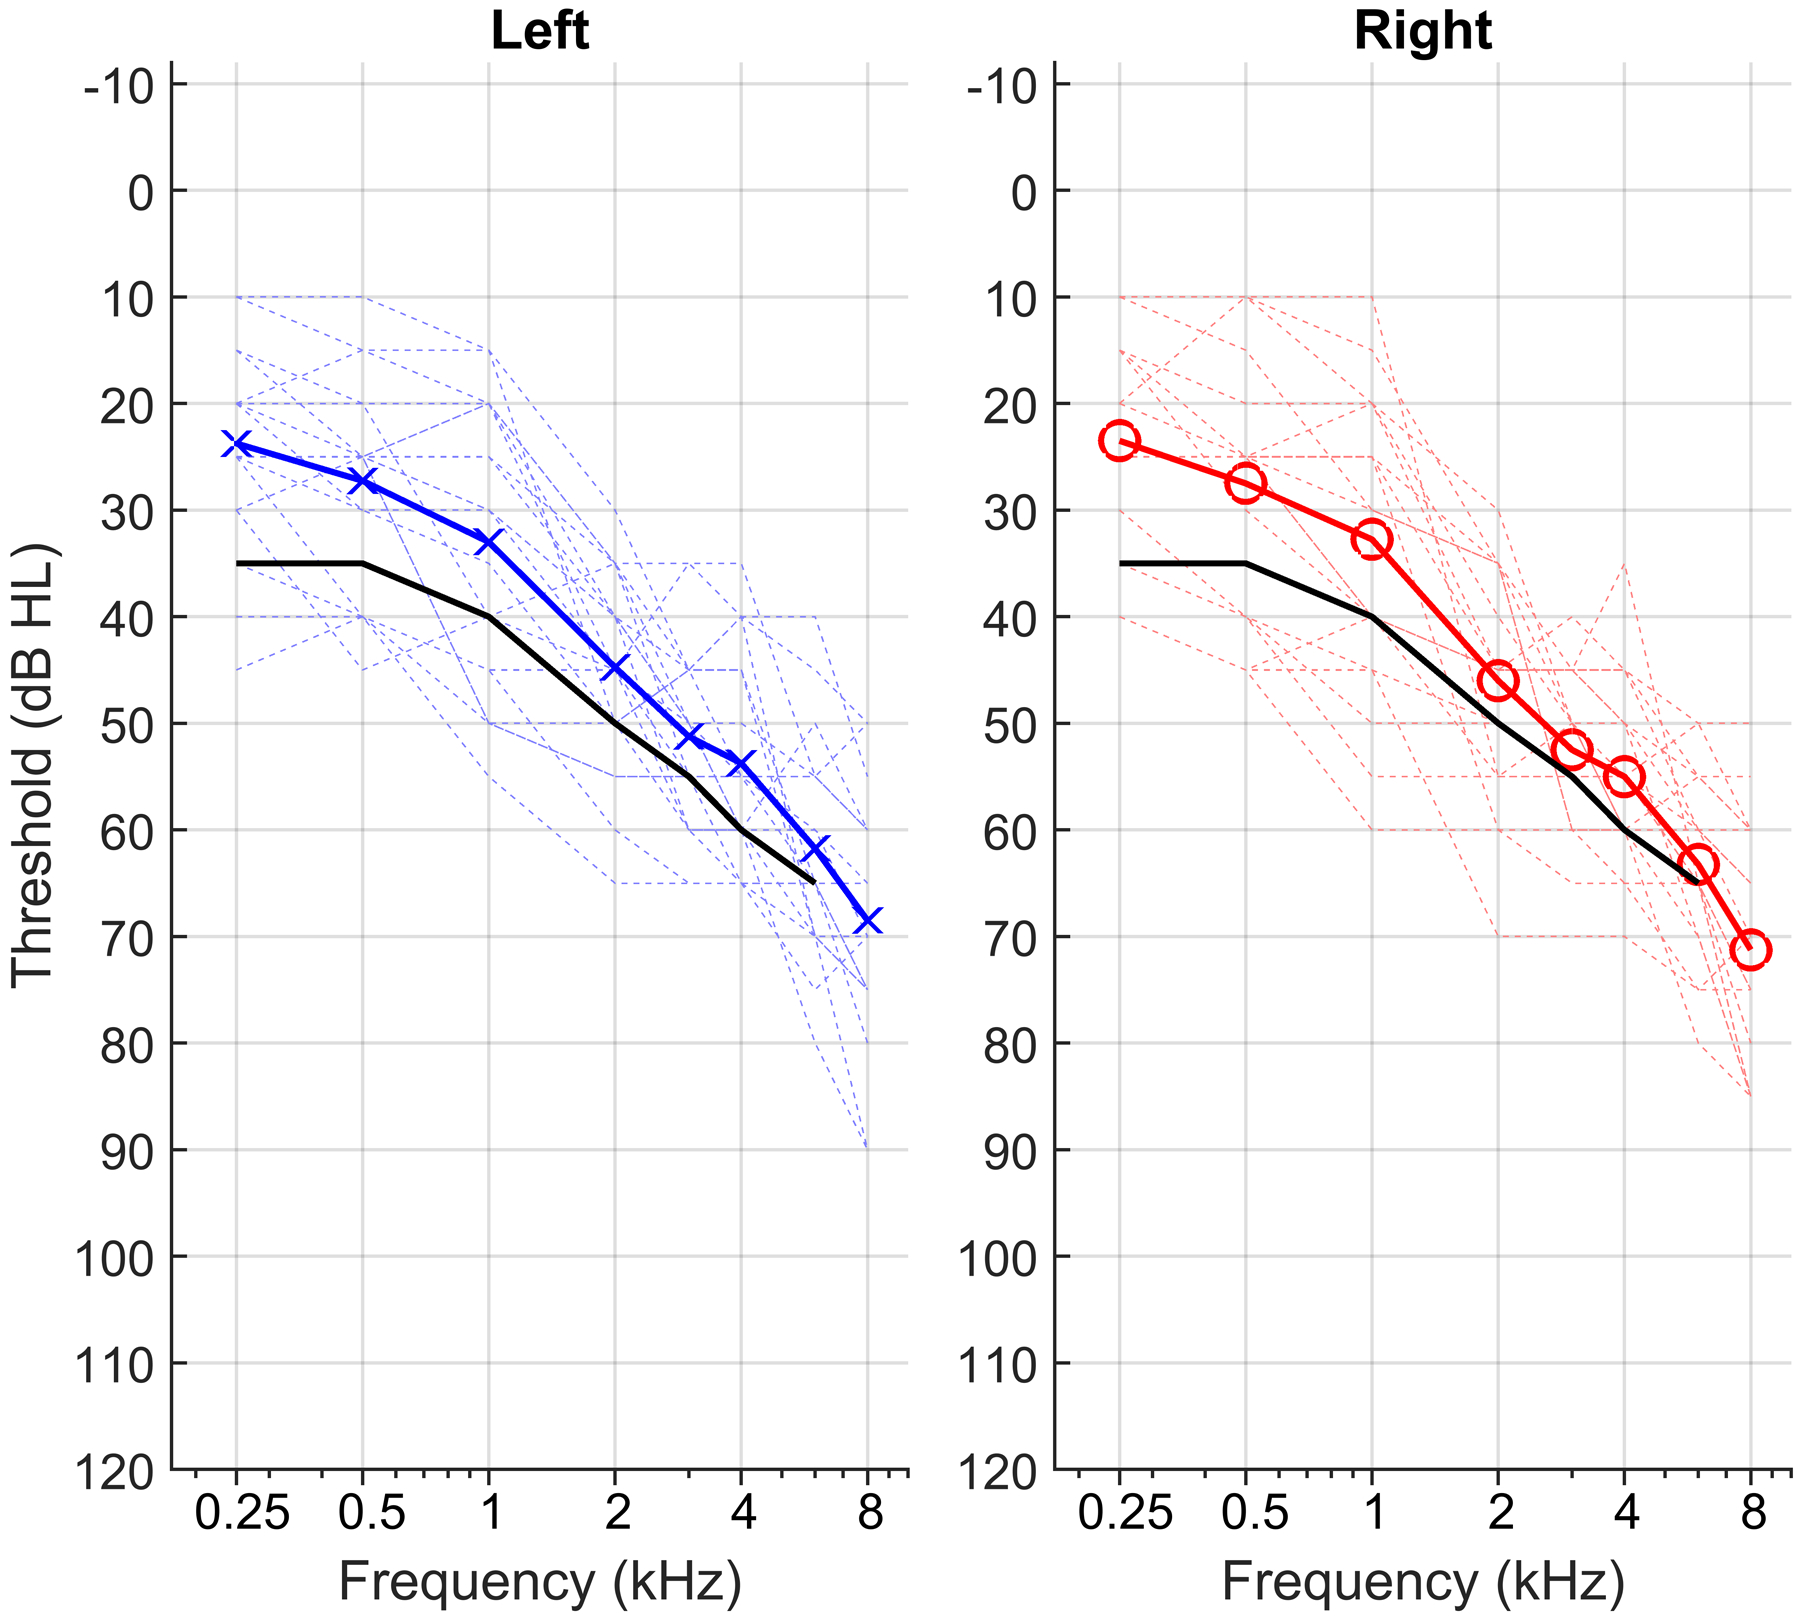
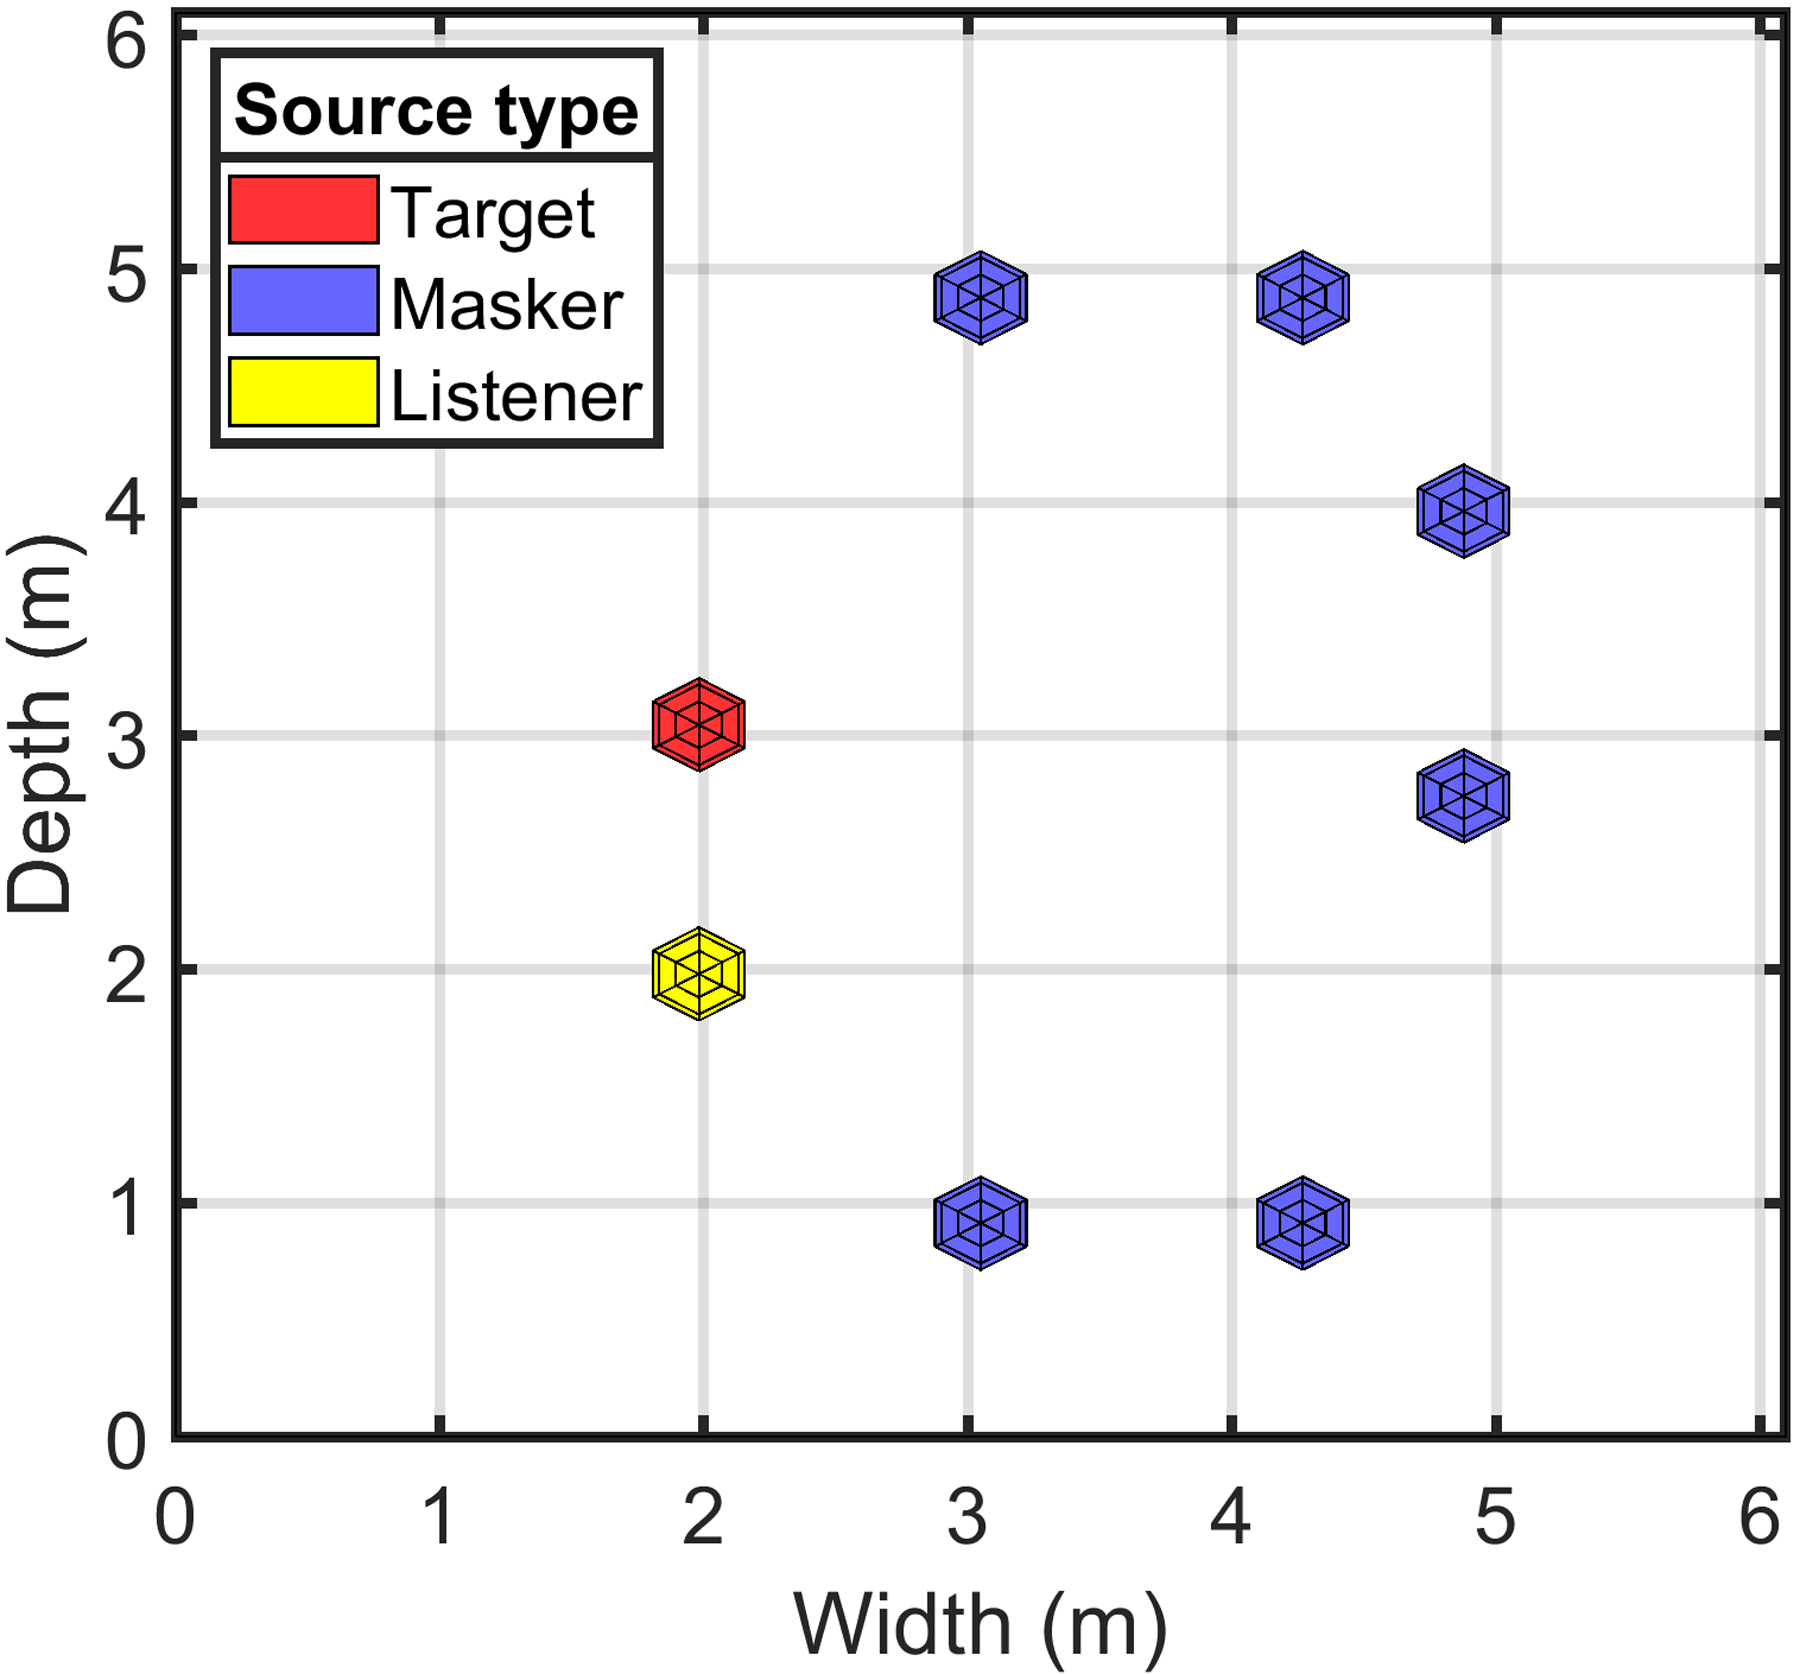
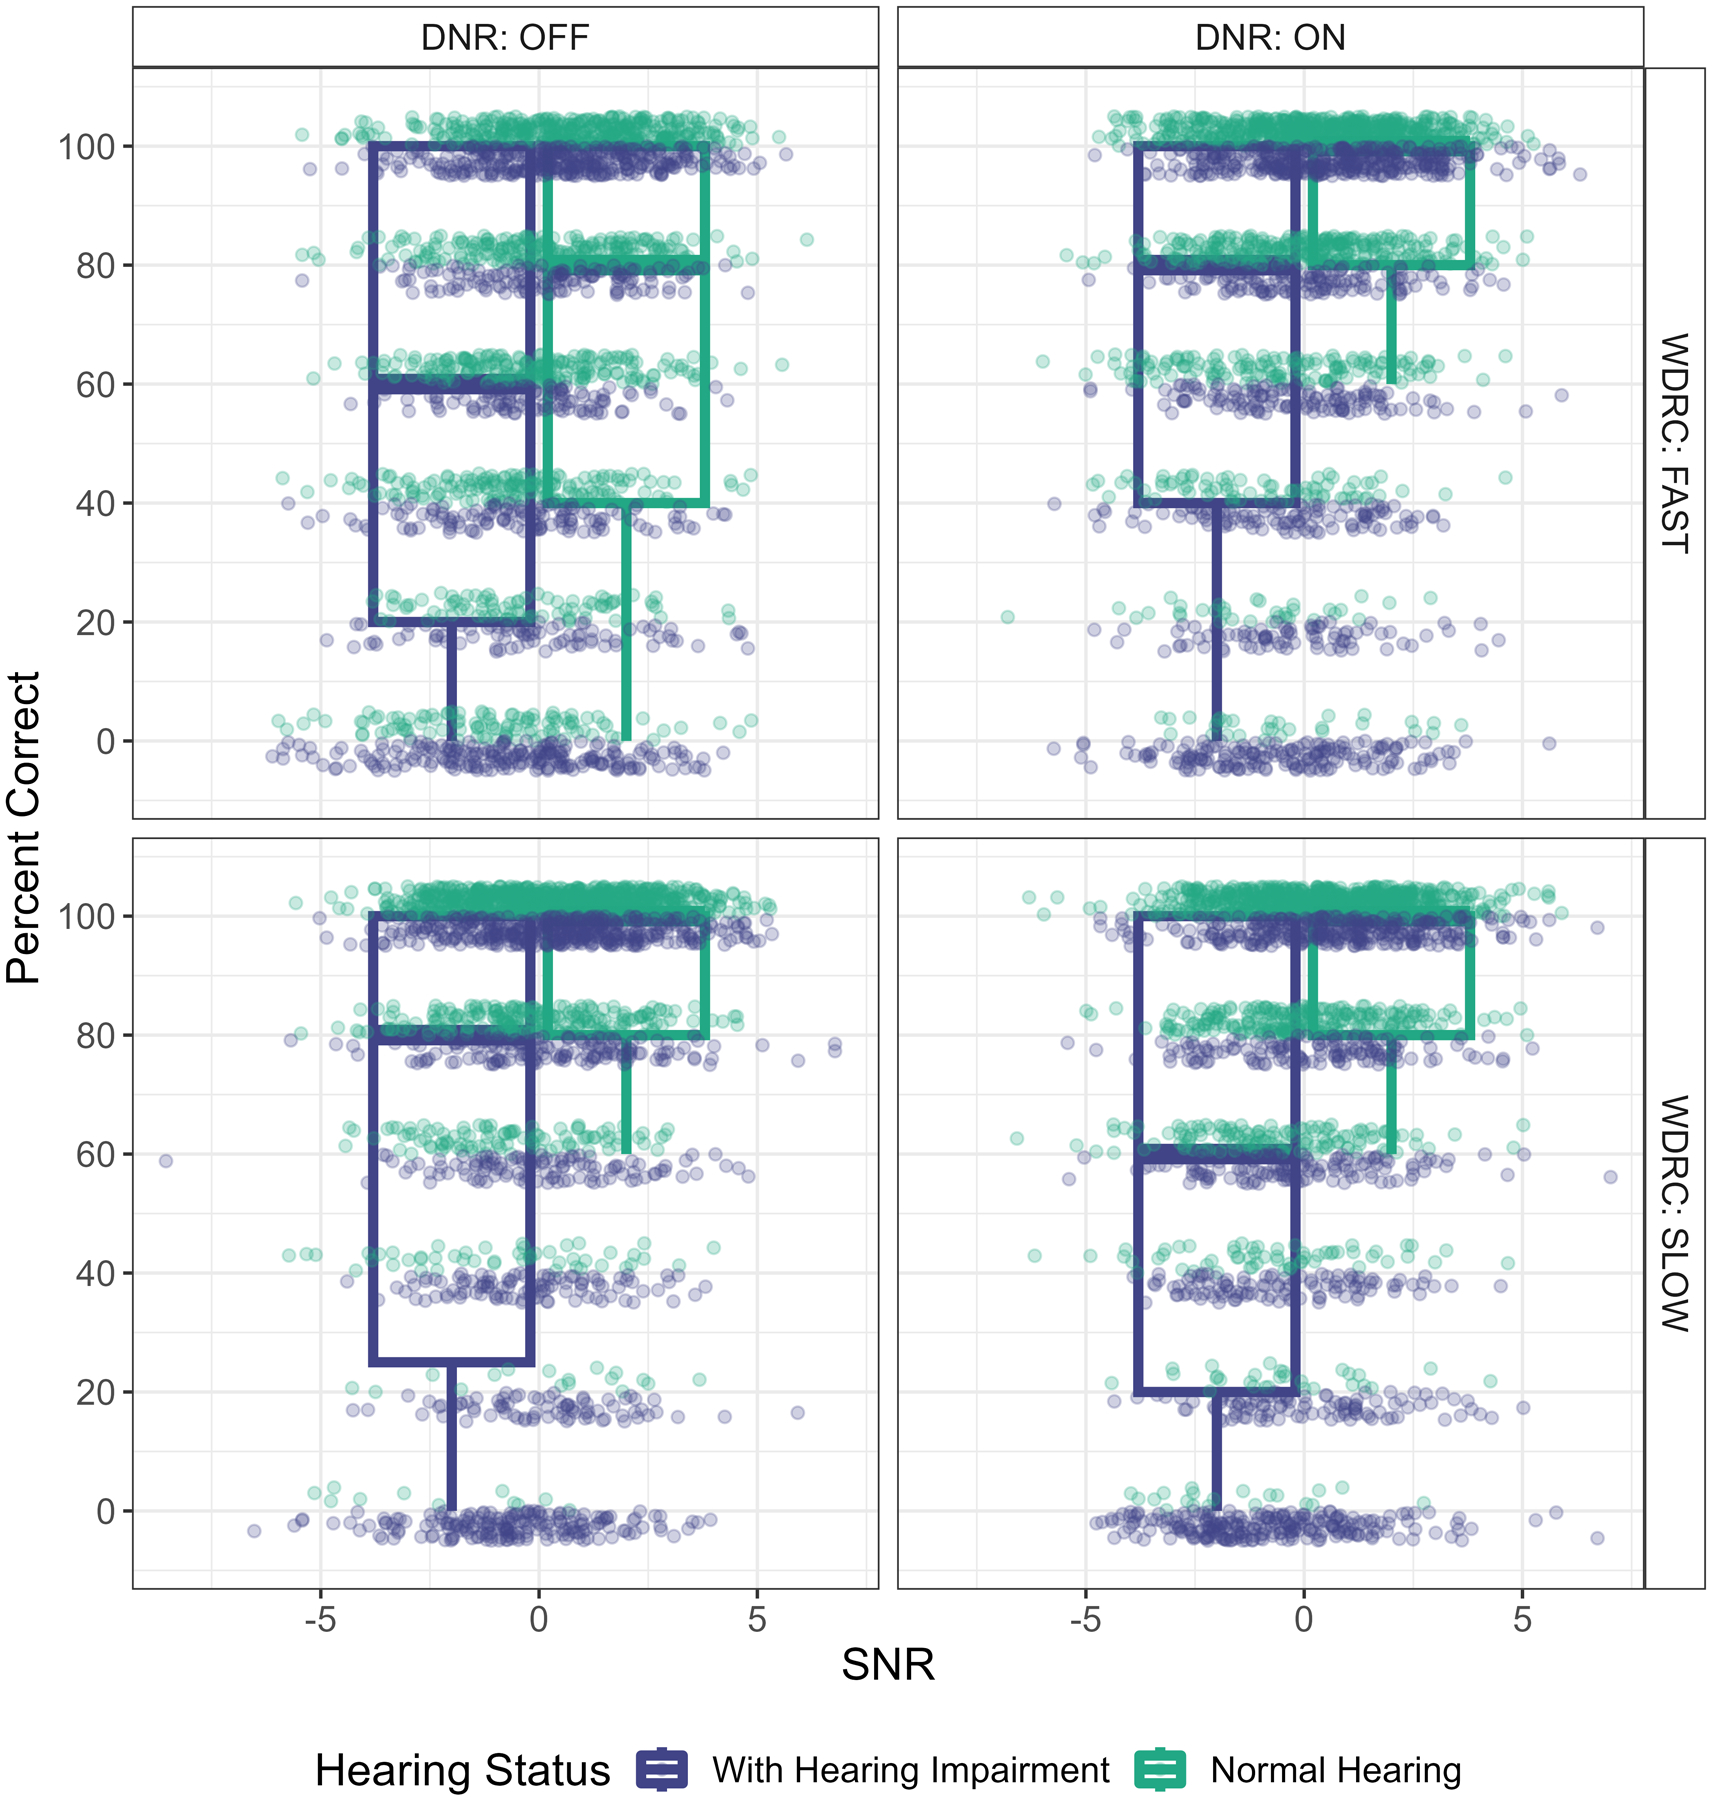
Design: Participants of greatest interest were listeners with hearing impairment. A group of listeners with clinically normal hearing was included to assess the effects of the simulation absent the complex effects of hearing loss. Virtual auditory space techniques were used to simulate a small restaurant listening environment with two different reverberation times (0.8 and 1.8 sec) in a range of signal to noise ratios (SNRs) (-8.5 to 11.5 dB SNR). Six spatialized competing talkers were included to further enhance realism. A hearing aid simulation was used to examine the degree to which speech intelligibility was affected by slow and fast WDRC in conjunction with the presence or absence of DNR. The WDRC and DNR settings were chosen to be reasonable estimates of hearing aids currently available to consumers.
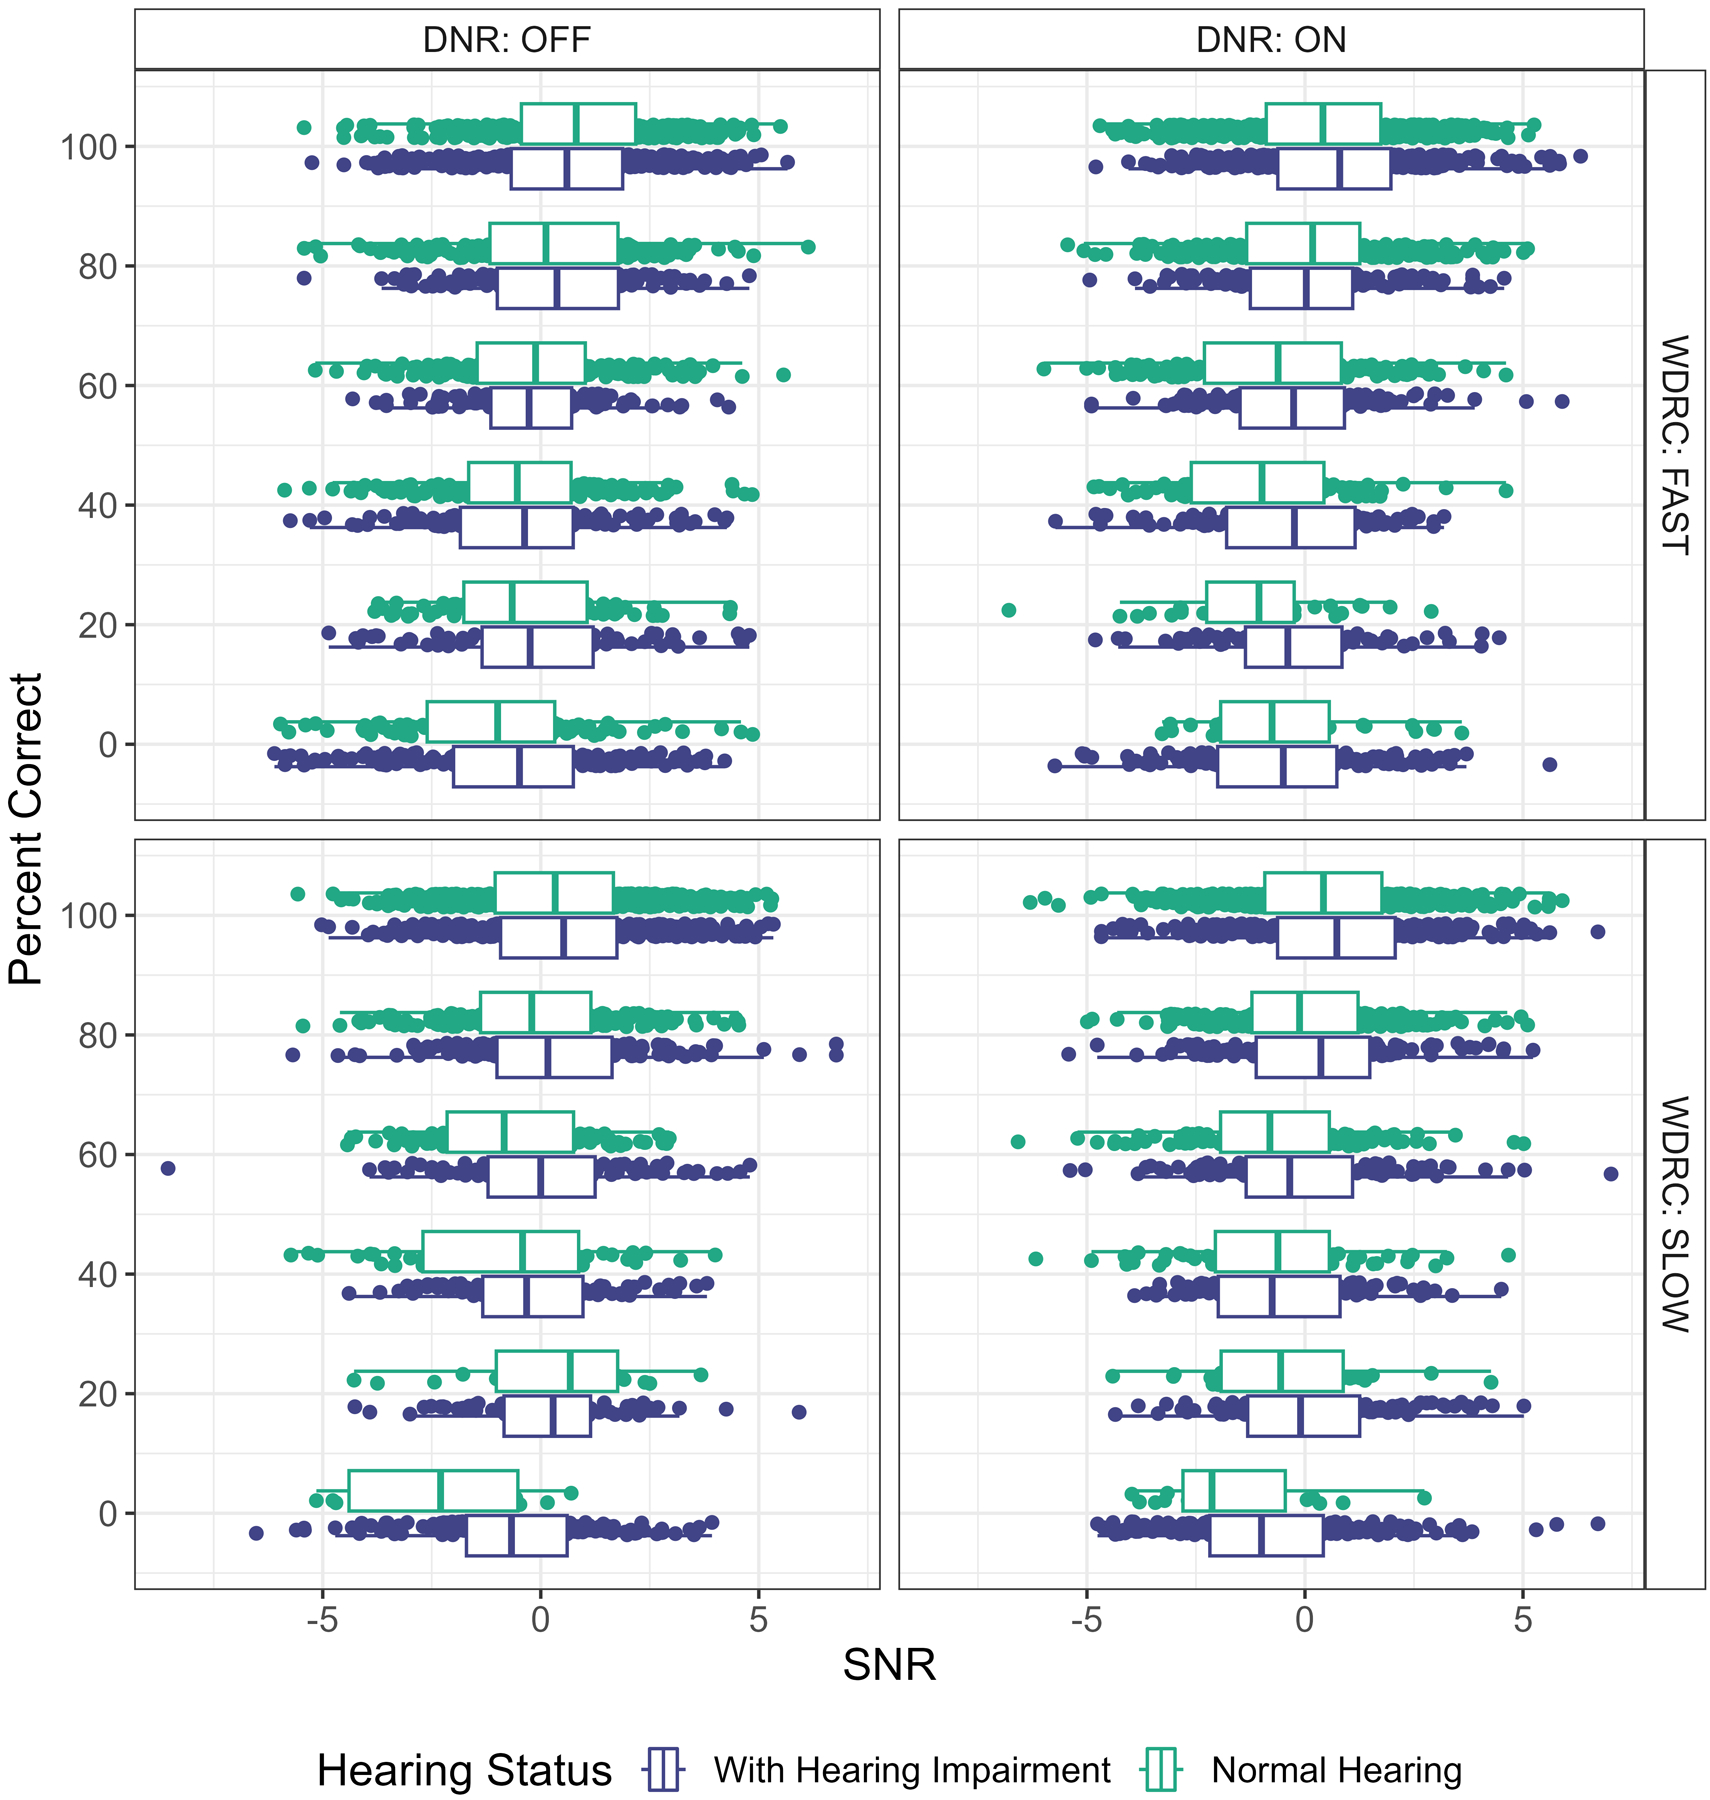
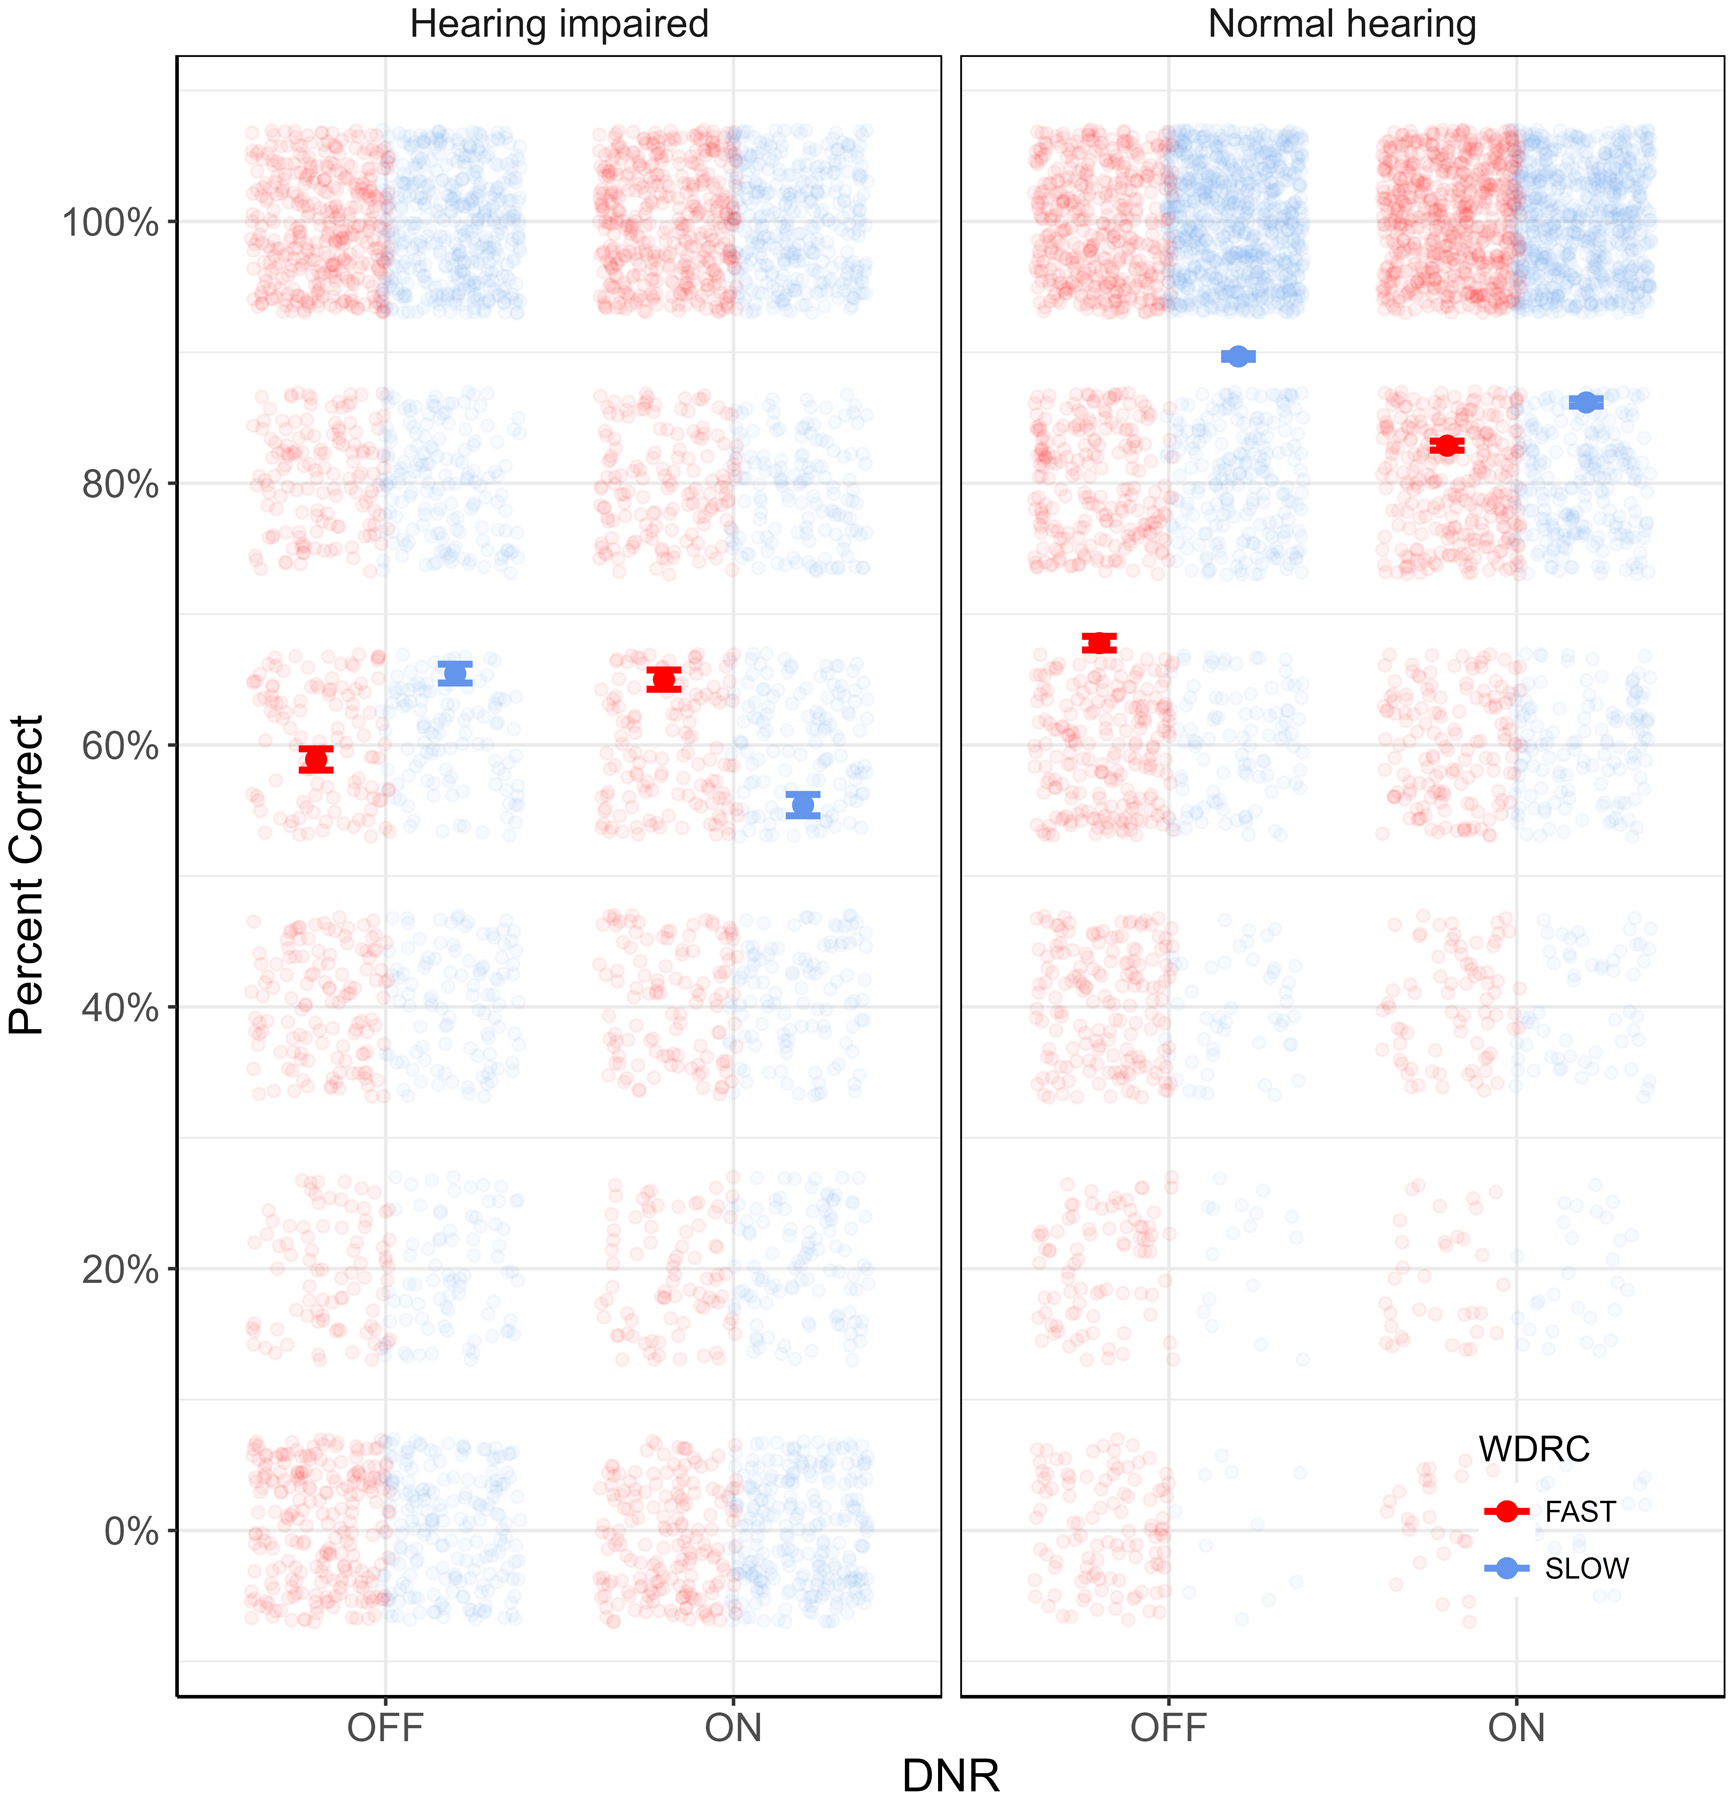
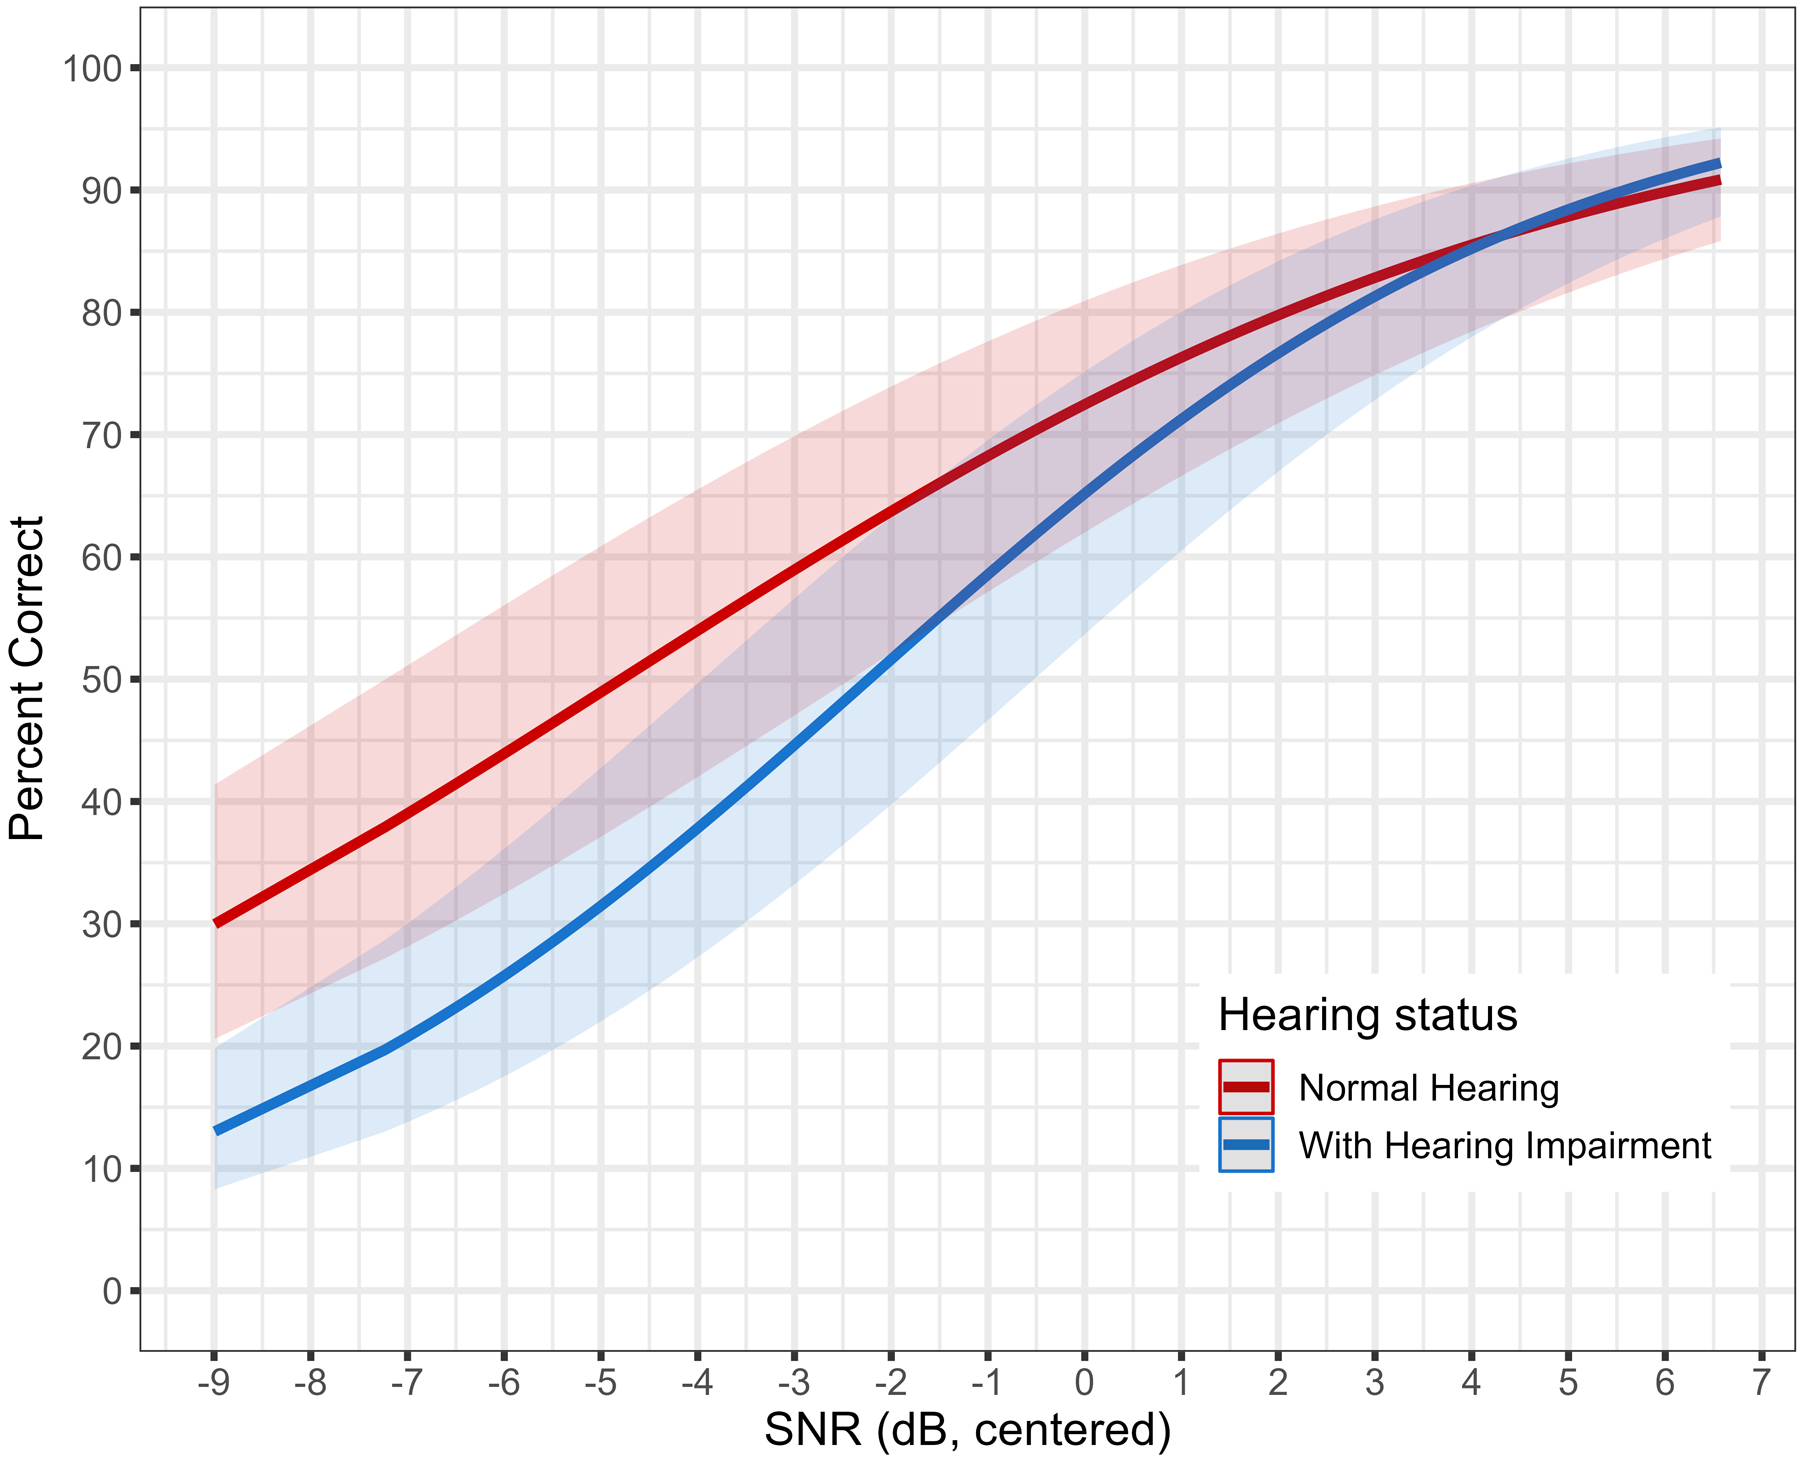
Results: A WDRC × DNR × Hearing Status interaction was observed, such that DNR was beneficial for speech intelligibility when combined with fast WDRC speeds, but DNR was detrimental to speech intelligibility when WDRC speeds were slow. The pattern of the WDRC × DNR interaction was observed for both listener groups. Significant main effects of reverberation time and SNR were observed, indicating better performance with lower reverberation times and more positive SNR.
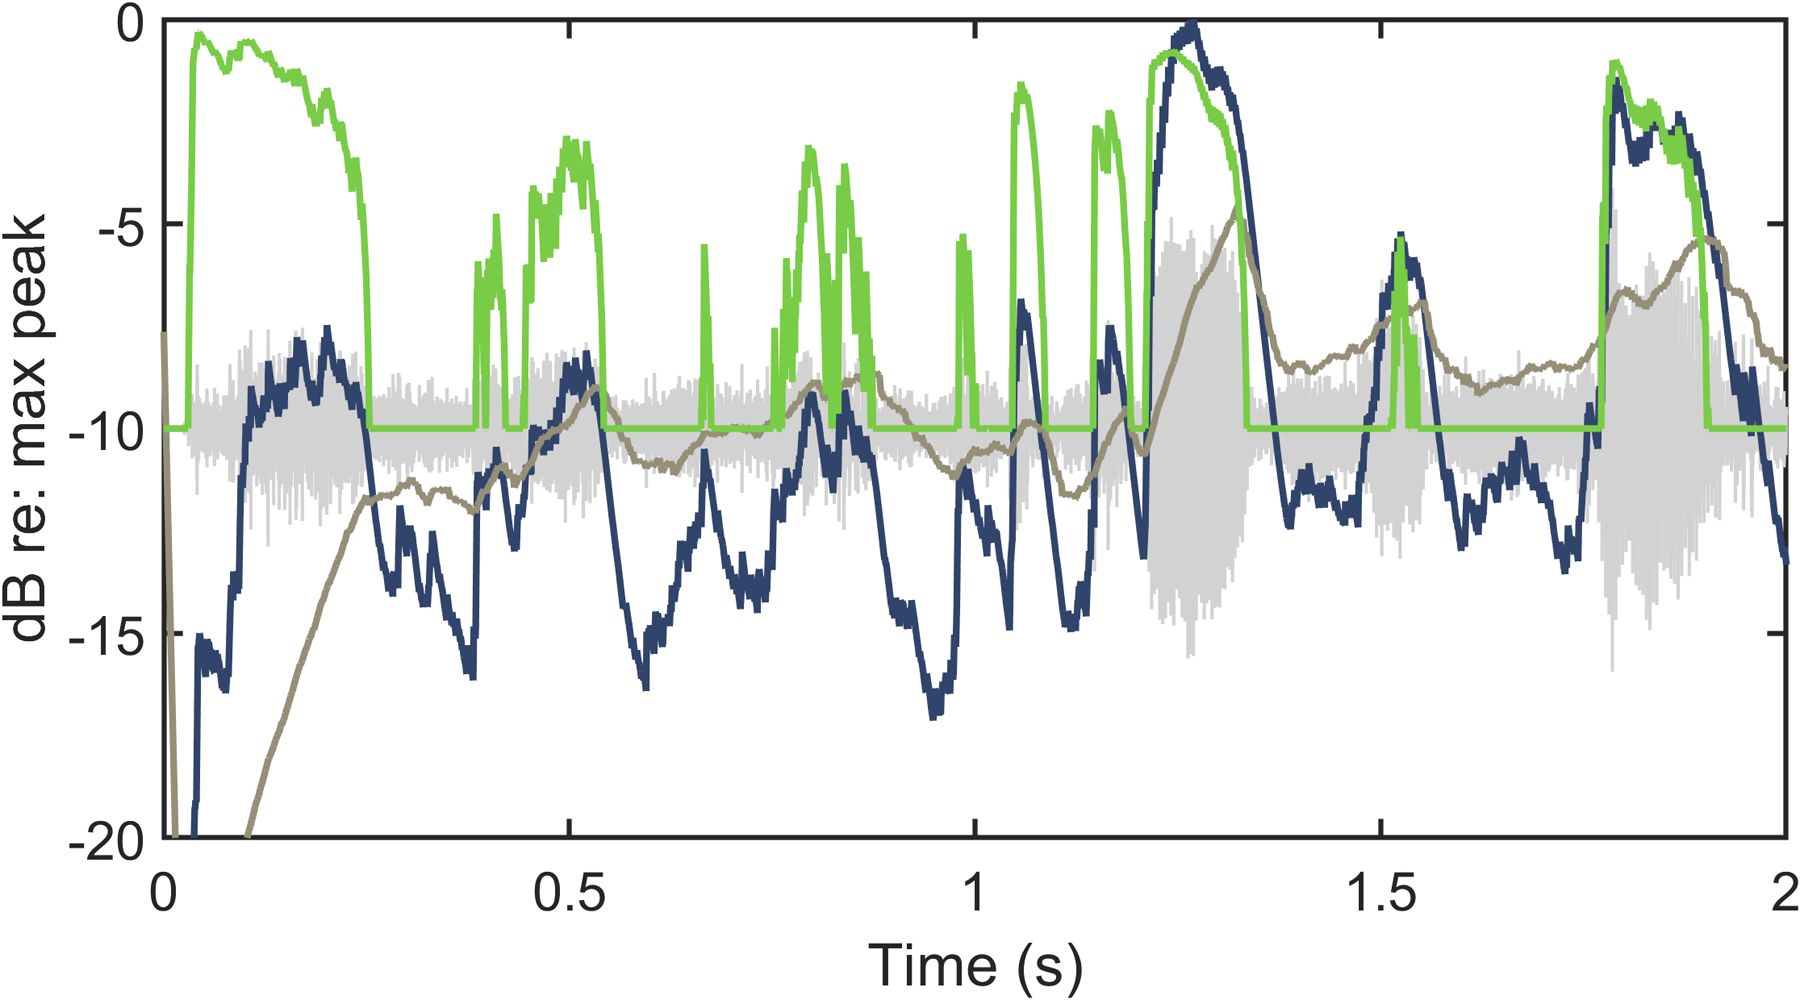
Conclusions: DNR reduced low-amplitude noise before WDRC-amplified the low-intensity portions of the signal, negating one potential downside of fast WDRC and leading to an improvement in speech intelligibility in this simulation. These data suggest that, in some real-world environments that include both reverberation and noise, older listeners with hearing impairment may find speech to be more intelligible if DNR is activated when the hearing aid has fast compression time constants. Additional research is needed to determine the appropriate DNR strength and to confirm results in wearable hearing aids and a wider range of listening environments.
Copyright © 2024 Wolters Kluwer Health, Inc. All rights reserved.
Conflict of interest statement
The authors have no conflicts of interest to disclose.
Figures
Similar articles
-
Interactions Between Digital Noise Reduction and Reverberation: Acoustic and Behavioral Effects.J Am Acad Audiol. 2020 Jan;31(1):17-29. doi: 10.3766/jaaa.18048. Epub 2019 Jul 1. J Am Acad Audiol. 2020. PMID: 31267958 Free PMC article.
-
Preference for Combinations of Hearing Aid Signal Processing.J Speech Lang Hear Res. 2022 Aug 17;65(8):3100-3116. doi: 10.1044/2022_JSLHR-22-00018. Epub 2022 Jul 26. J Speech Lang Hear Res. 2022. PMID: 35881878
-
Relationship Between Working Memory, Compression, and Beamformers in Ideal Conditions.Ear Hear. 2025 Mar-Apr 01;46(2):523-536. doi: 10.1097/AUD.0000000000001605. Epub 2024 Nov 6. Ear Hear. 2025. PMID: 39620655
-
A systematic review and meta-analysis of digital noise reduction hearing aids in adults.Disabil Rehabil Assist Technol. 2021 Feb;16(2):120-129. doi: 10.1080/17483107.2019.1642394. Epub 2019 Sep 10. Disabil Rehabil Assist Technol. 2021. PMID: 31502900
-
A critical review of hearing-aid single-microphone noise-reduction studies in adults and children.Disabil Rehabil Assist Technol. 2018 Aug;13(6):600-608. doi: 10.1080/17483107.2017.1392619. Epub 2017 Oct 26. Disabil Rehabil Assist Technol. 2018. PMID: 29072542 Review.
Cited by
-
Benefit of Hearing-Aid Amplification and Signal Enhancement for Speech Reception in Complex Listening Situations.Trends Hear. 2024 Jan-Dec;28:23312165241271407. doi: 10.1177/23312165241271407. Trends Hear. 2024. PMID: 39397631 Free PMC article.
-
Binaural speech intelligibility for combinations of noise, reverberation, and hearing-aid signal processing.PLoS One. 2025 Jan 15;20(1):e0317266. doi: 10.1371/journal.pone.0317266. eCollection 2025. PLoS One. 2025. PMID: 39813264 Free PMC article.
References
-
- Allen JB, & Berkley DA (1979). Image method for efficiently simulating small‐room acoustics. Journal of the Acoustical Society of America, 65(4), 943–950.
-
- Arslan L, McCree A, & Viswanathan V (1995). New methods for adaptive noise suppression. Paper presented at the 1995 International Conference on Acoustics, Speech, and Signal Processing.
-
- Battaglia PL (2014). Achieving acoustical comfort in restaurants. Paper presented at the Proceedings of Meetings on Acoustics 168ASA.
Publication types
MeSH terms
Grants and funding
LinkOut - more resources
Full Text Sources
Medical
Miscellaneous
