

Effects of Thyroid Powder on Tadpole (Lithobates catesbeiana) Metamorphosis and Growth: The Role of Lipid Metabolism and Gut Microbiota
- PMID: 38254377
- PMCID: PMC10812769
- DOI: 10.3390/ani14020208
Effects of Thyroid Powder on Tadpole (Lithobates catesbeiana) Metamorphosis and Growth: The Role of Lipid Metabolism and Gut Microbiota
Abstract
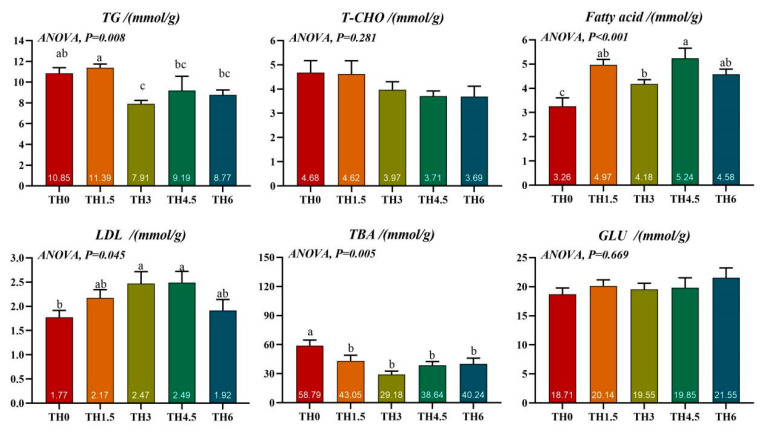
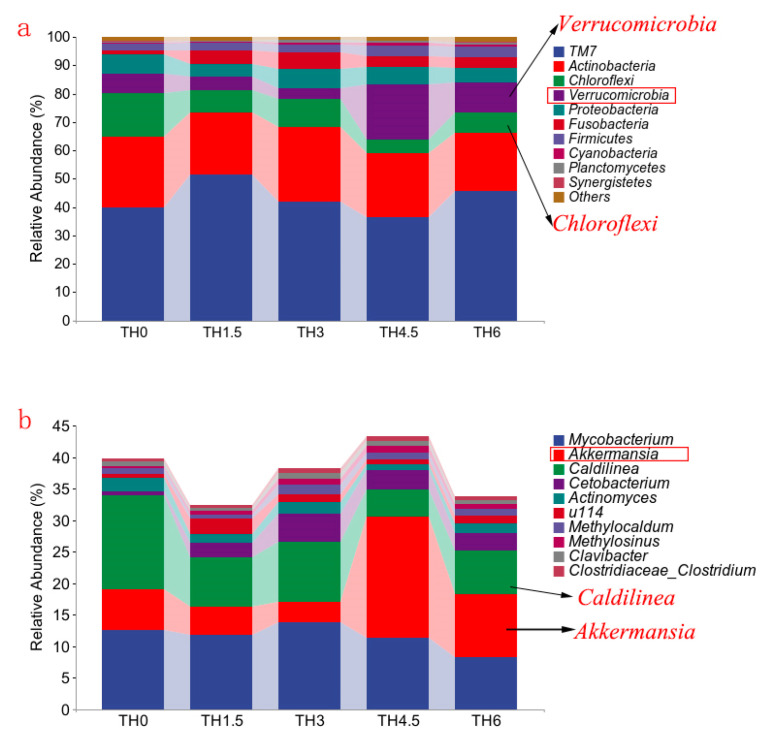
A low metamorphosis rate of amphibian larvae, commonly known as tadpoles, limits the farming production of bullfrogs (Lithobates catesbeiana). This study aimed to examine the effects of processed thyroid powder as a feed additive on tadpole metamorphosis, lipid metabolism, and gut microbiota. Five groups of tadpoles were fed with diets containing 0 g/kg (TH0), 1.5 g/kg (TH1.5), 3 g/kg (TH3), 4.5 g/kg (TH4.5), and 6 g/kg (TH6) thyroid powder for 70 days. The results showed that TH increased the average weight of tadpoles during metamorphosis, with the TH6 group having the highest values. The TH4.5 group had the highest metamorphosis rate (p < 0.05). Biochemical tests and Oil Red O staining showed that the lipid (triglyceride) content in the liver decreased after TH supplementation, especially at doses higher than 1.5 g/kg. RT-qPCR revealed that TH at doses higher than 4.5 g/kg significantly up-regulated the transcriptional expression of the pparα, accb, fas, fadd6, acadl, and lcat genes, which are related to lipid metabolism (p < 0.05). These results showed that TH seems to simultaneously promote the synthesis and decomposition of lipid and fatty acids, but ultimately show a decrease in lipids. As for the gut microbiota, it is noteworthy that Verrucomicrobia increased significantly in the TH4.5 and TH6 groups, and the Akkermansia (classified as Verrucomicrobia) was the corresponding genus, which is related to lipid metabolism. Specifically, the metabolic pathways of the gut microbiota were mainly enriched in metabolic-related functions (such as lipid metabolism), and there were significant differences in metabolic and immune pathways between the TH4.5 and TH0 groups (p < 0.05). In summary, TH may enhance lipid metabolism by modulating the gut microbiota (especially Akkermansia), thereby promoting the growth of tadpoles. Consequently, a supplementation of 4.5 g/kg or 6 g/kg of TH is recommended for promoting the metamorphosis and growth of tadpoles.
Keywords: amphibians; bullfrog; gut microbiota; lipid metabolism; metamorphosis.
Conflict of interest statement
The authors declare no conflicts of interest.
Figures


Similar articles
-
Transcriptomic profiling of Rana [Lithobates] catesbeiana back skin during natural and thyroid hormone-induced metamorphosis under different temperature regimes with particular emphasis on innate immune system components.Comp Biochem Physiol Part D Genomics Proteomics. 2024 Jun;50:101238. doi: 10.1016/j.cbd.2024.101238. Epub 2024 May 1. Comp Biochem Physiol Part D Genomics Proteomics. 2024. PMID: 38714098
-
Sucralose Affects Thyroid Hormone Signaling in American Bullfrog [Rana (Lithobates) catesbeiana] Tadpoles.Arch Environ Contam Toxicol. 2021 May;80(4):735-744. doi: 10.1007/s00244-021-00838-y. Epub 2021 Mar 31. Arch Environ Contam Toxicol. 2021. PMID: 33787960
-
Defining components of early thyroid hormone signalling through temperature-mediated activation of molecular memory in cultured Rana [lithobates] catesbeiana tadpole back skin.Gen Comp Endocrinol. 2024 Feb 1;347:114440. doi: 10.1016/j.ygcen.2023.114440. Epub 2023 Dec 29. Gen Comp Endocrinol. 2024. PMID: 38159870
-
Autoinduction of nuclear receptor genes and its significance.J Steroid Biochem Mol Biol. 1993 Aug;46(2):105-19. doi: 10.1016/0960-0760(93)90286-6. J Steroid Biochem Mol Biol. 1993. PMID: 8664159 Review.
-
Neuroendocrinology of amphibian metamorphosis.Curr Top Dev Biol. 2013;103:195-227. doi: 10.1016/B978-0-12-385979-2.00007-1. Curr Top Dev Biol. 2013. PMID: 23347520 Review.
Cited by
-
Research Status and Prospect of Amphibian Symbiotic Microbiota.Animals (Basel). 2025 Mar 25;15(7):934. doi: 10.3390/ani15070934. Animals (Basel). 2025. PMID: 40218328 Free PMC article. Review.
-
Feasibility Evaluation of Dried Whole Egg Powder Application in Tadpole (Lithobates catesbeianus) Feed: Effects on Growth, Metamorphosis Rate, Lipid Metabolism and Intestinal Flora.Animals (Basel). 2025 Feb 18;15(4):584. doi: 10.3390/ani15040584. Animals (Basel). 2025. PMID: 40003064 Free PMC article.
References
-
- Funk W.C., Garcia T.S., Cortina G.A., Hill R.H. Population genetics of introduced bullfrogs, Rana (Lithobates) catesbeianus, in the Willamette Valley, Oregon, USA. Biol. Invasions. 2011;13:651–658. doi: 10.1007/s10530-010-9855-z. - DOI
Grants and funding
LinkOut - more resources
Full Text Sources
Research Materials
Miscellaneous
