. 2024 Jan 15;12(1):188.
doi: 10.3390/biomedicines12010188.

The Traumatic Inoculation Process Affects TSPO Radioligand Uptake in Experimental Orthotopic Glioblastoma

Affiliations

The Traumatic Inoculation Process Affects TSPO Radioligand Uptake in Experimental Orthotopic Glioblastoma

Lukas Gold et al. Biomedicines. .

Abstract

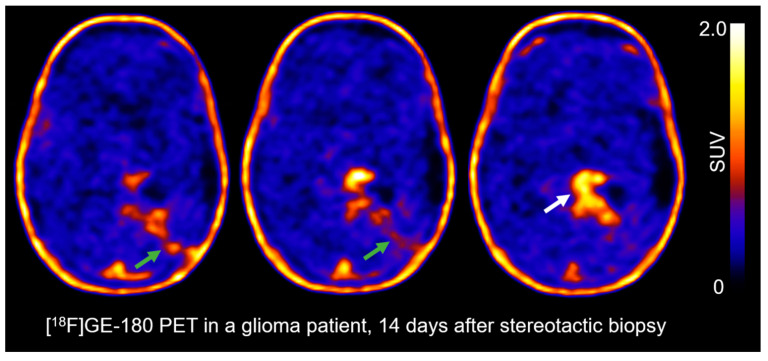
Background: The translocator protein (TSPO) has been proven to have great potential as a target for the positron emission tomography (PET) imaging of glioblastoma. However, there is an ongoing debate about the potential various sources of the TSPO PET signal. This work investigates the impact of the inoculation-driven immune response on the PET signal in experimental orthotopic glioblastoma.

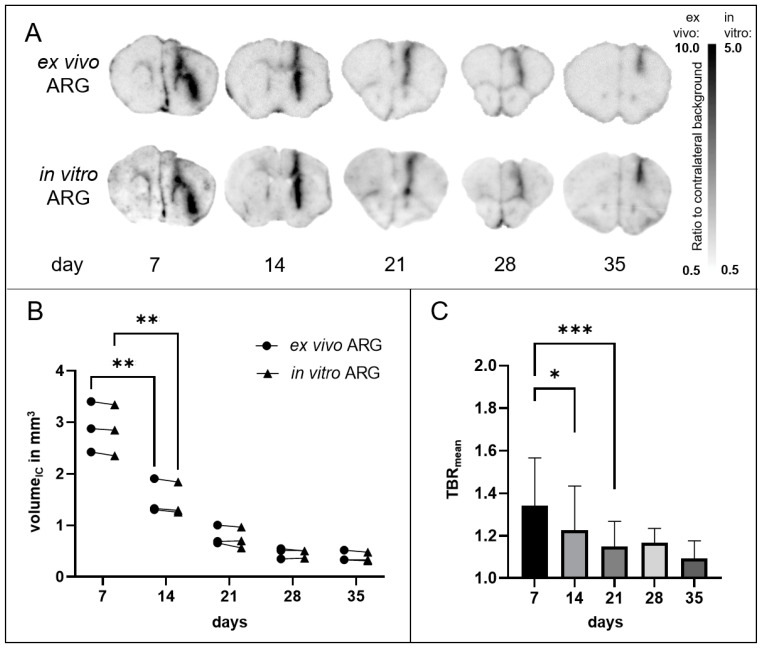
Methods: Serial [18F]GE-180 and O-(2-[18F]fluoroethyl)-L-tyrosine ([18F]FET) PET scans were performed at day 7/8 and day 14/15 after the inoculation of GL261 mouse glioblastoma cells (n = 24) or saline (sham, n = 6) into the right striatum of immunocompetent C57BL/6 mice. An additional n = 25 sham mice underwent [18F]GE-180 PET and/or autoradiography (ARG) at days 7, 14, 21, 28, 35, 50 and 90 in order to monitor potential reactive processes that were solely related to the inoculation procedure. In vivo imaging results were directly compared to tissue-based analyses including ARG and immunohistochemistry.

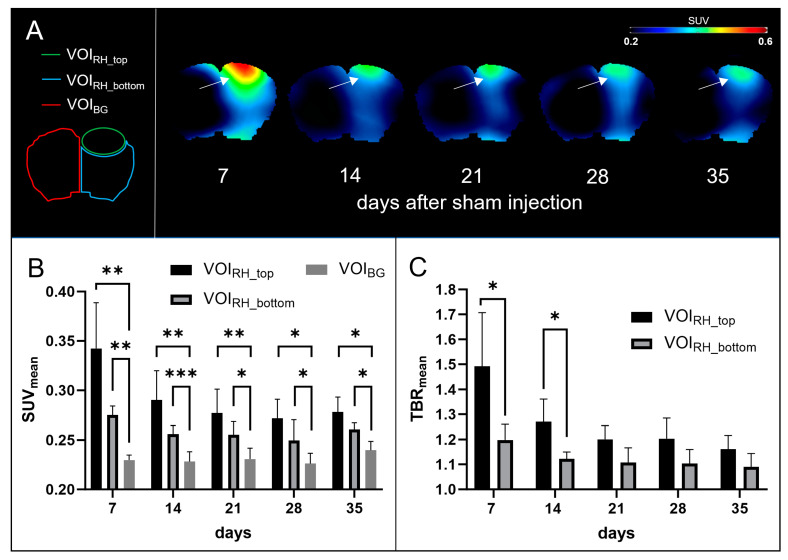
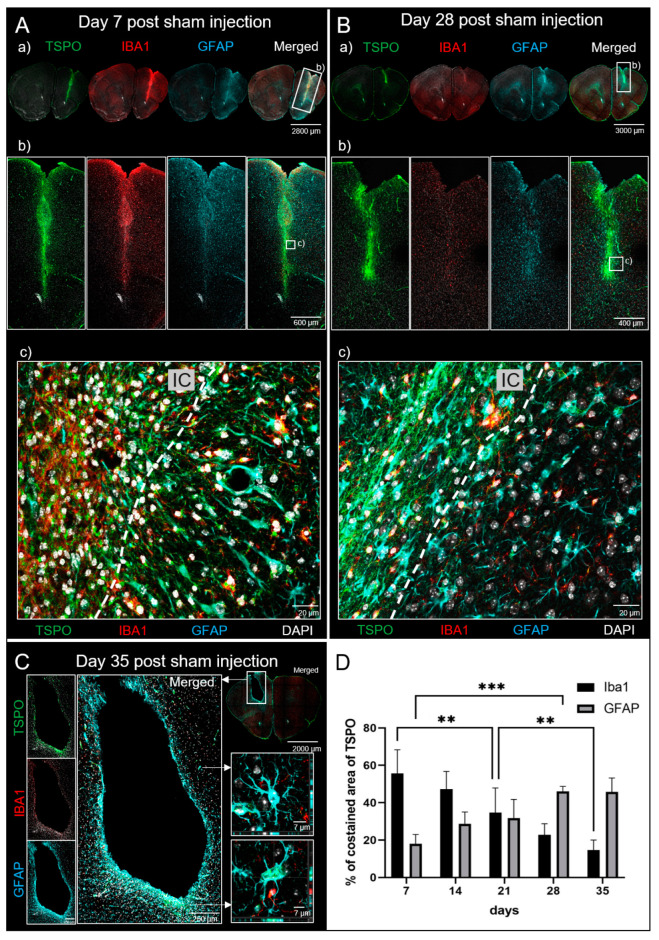
Results: We found that the inoculation process represents an immunogenic event, which significantly contributes to TSPO radioligand uptake. [18F]GE-180 uptake in GL261-bearing mice surpassed [18F]FET uptake both in the extent and the intensity, e.g., mean target-to-background ratio (TBRmean) in PET at day 7/8: 1.22 for [18F]GE-180 vs. 1.04 for [18F]FET, p < 0.001. Sham mice showed increased [18F]GE-180 uptake at the inoculation channel, which, however, continuously decreased over time (e.g., TBRmean in PET: 1.20 at day 7 vs. 1.09 at day 35, p = 0.04). At the inoculation channel, the percentage of TSPO/IBA1 co-staining decreased, whereas TSPO/GFAP (glial fibrillary acidic protein) co-staining increased over time (p < 0.001).

Conclusion: We identify the inoculation-driven immune response to be a relevant contributor to the PET signal and add a new aspect to consider for planning PET imaging studies in orthotopic glioblastoma models.

Keywords: TSPO PET and autoradiography; glioblastoma; immunohistochemistry; orthotopic implantation; traumatic brain injury (TBI).


Conflict of interest statement

The authors declare no competing interests. M.B. received speaker honoraria from GE healthcare, Roche and LMI and is an advisor of LMI and MIAC. N.L.A. has received honoraria for consultation or advisory board participation from Novartis/Advanced Accelerator Applications, Telix Pharmaceuticals and Servier and research funding from Novocure. A.H. is an advisor of ABX advanced biochemical compounds.

Figures

Figure 1
Figure 1
Comparison of [18F]GE-180 and [18F]FET uptake in GL261-implanted mice. (A) Coronal H&E slices show examples for alterations in tumor growth as the result of the inoculation process. Top: tumor cells expand along the inoculation channel. Bottom: tumor cells infiltrate the ventricular system and reach the skull base. White arrows point at the tumor. (B) Uptake at the tumor edge (in vitro [18F]GE-180 ARG, left, tumor marked by white arrow) versus uptake at the tumor center (ex vivo [18F]FET ARG, middle) at day 15 after tumor inoculation. Consecutive transversal slices, and a correlating HE slice are shown. (C) Immunohistochemistry showing co-staining of TSPO, IBA1 and GFAP (left) in a transversal slice of a GL261-inoculated C57/BL6J mouse at day 19 after tumor inoculation. B = peritumoral background, G = area containing glioma cells. High numbers of TSPO-labelled astrocytes (white arrow) and neuroinflammatory cells (yellow arrow) behind the glioma cell border (long dotted line) can be seen. Top left shows a z-stack caption of a reactive astrocyte. LAT1 staining (right) shows high binding at the tumor and low binding behind the glioma cell border (dotted line). Top right shows staining at the tumor center, bottom right at contralateral control. (D) Comparisons of [18F]GE-180 ARG with PET (left) and of [18F]FET ARG and PET (right) at day 7/8 (upper row) and day 14/15 (lower row) after inoculation in coronal view. [18F]GE-180 clearly shows additional uptake at the IC (arrows with blue arrowhead). White delineations mark the border of glioma cells at correlating HE staining. (E) SUVmean of inoculated hemispheres divided by SUVmean of contralateral unaffected hemispheres (=TBRmean) for [18F]GE-180 and [18F]FET PETs at day-7/8 (n = 23) and 14/15 (n = 17) after tumor inoculation. Student’s t-test: *, p < 0.05; **, p < 0.01; ***, p < 0.001. (F) SUVmean of hemispheres with inoculated tumors/sham inoculated, divided by SUVmean of contralateral unaffected hemispheres (=TBRmean) for [18F]GE-180 PETs for n = 23, n = 5, n = 17 and n = 6 from left to right. Student’s t-test: *, p < 0.05; **, p < 0.01, ns = not significant. Values are presented as mean ± standard deviation (SD).
Figure 2
Figure 2
[18F]GE-180 PETs in sham mice. (A) On the left, VOIRH_top (green), VOIRH_bottom (blue) and VOILH (red) are projected on a healthy mouse brain in coronal view. On the right, representative PETs of sham-operated mice are shown. White arrows point at the highest signal at the superior brain edge, probably related to meningeal uptake. (B) SUVmean of day 7 (n = 5), day 14 (n = 6), day 21 (n = 4), day 28 (n = 4) and day 35 (n = 4). Student’s t-test: *, p < 0.05; **, p < 0.01; ***, p < 0.001. (C) TBRmean for VOIRH_top and VOIRH_bottom. One-way ANOVA p = 0.004 for VOIRH_top, and p = 0.04 for VOIRH_bottom. Student’s t-test: *, p < 0.05. Values are presented as mean ± SD.
Figure 3
Figure 3
[18F]GE-180 autoradiographies (ARGs) in sham mice. (A) Representative ARGs at different time points after sham injection in coronal view. Ex vivo and in vitro ARGs show nearly congruent signals with easily delineable IC. (B) Volumes in mm3 of ex vivo (circles) and in vitro (triangles) ARGs. Pairwise data of each mouse are connected by lines. One-way ANOVA for ex vivo ARG p < 0.001 and in vitro ARG < 0.001. Tukey Test: **, p < 0.01. (C) Tracer uptake intensity in right hemispheres divided by intensity in left hemispheres (=TBRmean) for slices displaying the IC at day 7 (n = 38 slices), 14 (n = 29), 21 (n = 23), 28 (n = 19), and 35 (n = 22) after sham injection. One-way ANOVA p < 0.001. Tukey Test: *, p < 0.05; ***, p < 0.001. Values are presented as mean ± SD.
Figure 4
Figure 4
TSPO, IBA1 and GFAP co-staining in sham mice. (A) Representative coronal IHC pictures at day 7 after sham injection showing a (a) brain overview, (b) zoom-in at IC and (c) detailed view of the IC edge at cellular level. All shown channels are merged with DAPI. Dotted lines mark the IC border. (B) Pictures at day 28 after sham injection in the same arrangement as in (A). IBA1 signal at the IC is clearly decreased compared to day 7 while TSPO and GFAP signals remain strong. (C) Rim-like structure of TSPO-positive astrocytes surrounding a cavity in the brain at the previous injection site 35 days after sham injection. The middle right picture shows the z-stack of a TSPO-negative astrocyte, while the bottom right picture shows the z-stack of a TSPO-labelled astrocyte. (D) Proportion of co-stained areas of IBA1 and GFAP with overall areas of TSPO expression at the IC at day 7 (n = 3), 14 (n = 3), 21 (n = 3), 28 (n = 3), and 35 (n = 2) with 2–3 analyzed slices per mouse. One-way ANOVA for IBA1 p < 0.001 and GFAP p < 0.001. Tukey Test: **, p < 0.01; ***, p < 0.001. Values are presented as mean ± SD.
Figure 5
Figure 5
Increased uptake along the biopsy trajectory in a human [18F]GE-180 PET. Transversal view of three adjacent sections side-by-side of the same PET scan with an interval of 4 mm each. TSPO PET was performed 14 days after serial stereotactic biopsy. A glioma recurrence was confirmed in the left parasagittal area with focally increased uptake (white arrow). Additionally, an increased radioligand uptake is noted along the biopsy trajectory (green arrows).

Similar articles

References

    1. Ostrom Q.T., Bauchet L., Davis F.G., Deltour I., Fisher J.L., Langer C.E., Pekmezci M., Schwartzbaum J.A., Turner M.C., Walsh K.M., et al. The epidemiology of glioma in adults: A state of the science review. Neuro Oncol. 2014;16:896–913. doi: 10.1093/neuonc/nou087. - DOI - PMC - PubMed
    1. Weller M., van den Bent M., Preusser M., Le Rhun E., Tonn J.C., Minniti G., Bendszus M., Balana C., Chinot O., Dirven L., et al. EANO guidelines on the diagnosis and treatment of diffuse gliomas of adulthood. Nat. Rev. Clin. Oncol. 2021;18:170–186. doi: 10.1038/s41571-020-00447-z. - DOI - PMC - PubMed
    1. Foray C., Barca C., Backhaus P., Schelhaas S., Winkeler A., Viel T., Schafers M., Grauer O., Jacobs A.H., Zinnhardt B. Multimodal Molecular Imaging of the Tumour Microenvironment. Adv. Exp. Med. Biol. 2020;1225:71–87. doi: 10.1007/978-3-030-35727-6_5. - DOI - PubMed
    1. Quail D.F., Joyce J.A. The Microenvironmental Landscape of Brain Tumors. Cancer Cell. 2017;31:326–341. doi: 10.1016/j.ccell.2017.02.009. - DOI - PMC - PubMed
    1. la Fougere C., Suchorska B., Bartenstein P., Kreth F.W., Tonn J.C. Molecular imaging of gliomas with PET: Opportunities and limitations. Neuro Oncol. 2011;13:806–819. doi: 10.1093/neuonc/nor054. - DOI - PMC - PubMed