

Graph Neural Network Model for Prediction of Non-Small Cell Lung Cancer Lymph Node Metastasis Using Protein-Protein Interaction Network and 18F-FDG PET/CT Radiomics
- PMID: 38255770
- PMCID: PMC10815846
- DOI: 10.3390/ijms25020698
Graph Neural Network Model for Prediction of Non-Small Cell Lung Cancer Lymph Node Metastasis Using Protein-Protein Interaction Network and 18F-FDG PET/CT Radiomics
Abstract
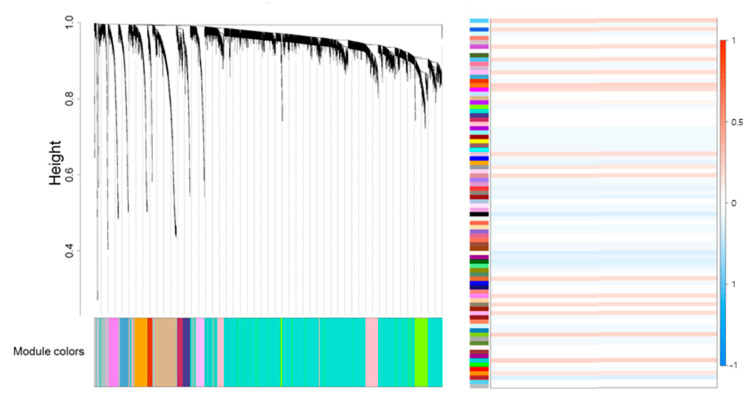
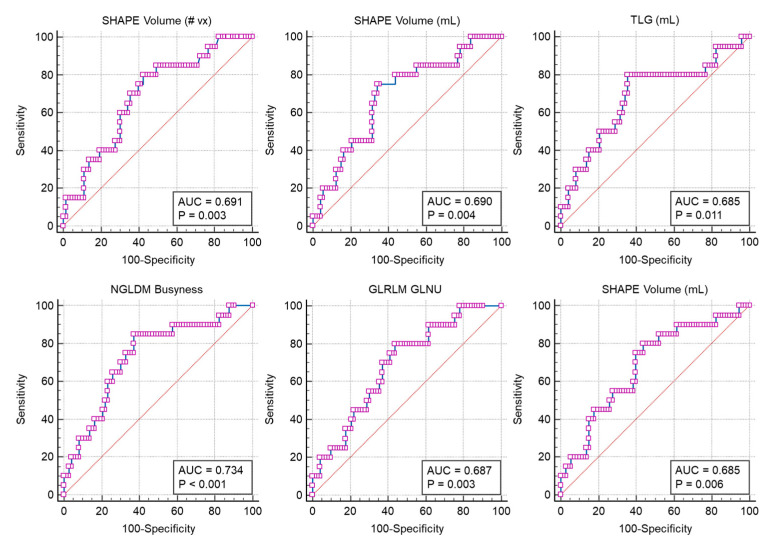
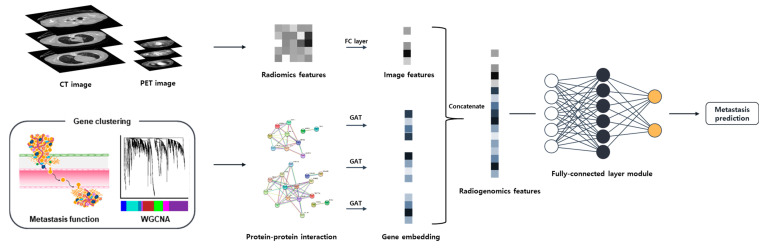
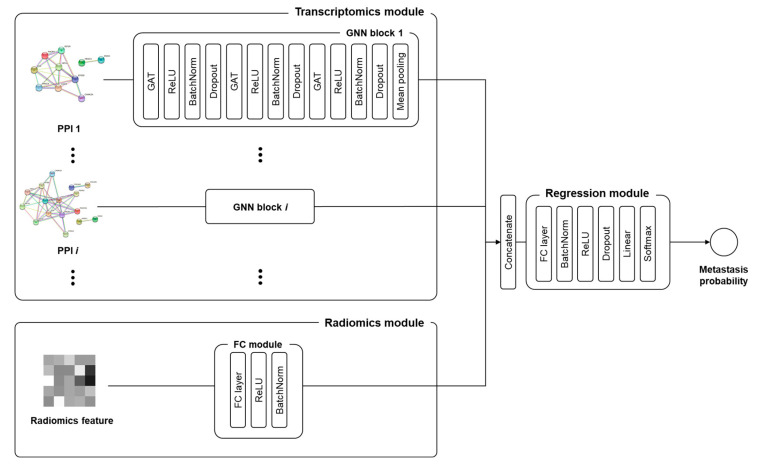
The image texture features obtained from 18F-fluorodeoxyglucose positron emission tomography/computed tomography (18F-FDG PET/CT) images of non-small cell lung cancer (NSCLC) have revealed tumor heterogeneity. A combination of genomic data and radiomics may improve the prediction of tumor prognosis. This study aimed to predict NSCLC metastasis using a graph neural network (GNN) obtained by combining a protein-protein interaction (PPI) network based on gene expression data and image texture features. 18F-FDG PET/CT images and RNA sequencing data of 93 patients with NSCLC were acquired from The Cancer Imaging Archive. Image texture features were extracted from 18F-FDG PET/CT images and area under the curve receiver operating characteristic curve (AUC) of each image feature was calculated. Weighted gene co-expression network analysis (WGCNA) was used to construct gene modules, followed by functional enrichment analysis and identification of differentially expressed genes. The PPI of each gene module and genes belonging to metastasis-related processes were converted via a graph attention network. Images and genomic features were concatenated. The GNN model using PPI modules from WGCNA and metastasis-related functions combined with image texture features was evaluated quantitatively. Fifty-five image texture features were extracted from 18F-FDG PET/CT, and radiomic features were selected based on AUC (n = 10). Eighty-six gene modules were clustered by WGCNA. Genes (n = 19) enriched in the metastasis-related pathways were filtered using DEG analysis. The accuracy of the PPI network, derived from WGCNA modules and metastasis-related genes, improved from 0.4795 to 0.5830 (p < 2.75 × 10⁻¹²). Integrating PPI of four metastasis-related genes with 18F-FDG PET/CT image features in a GNN model elevated its accuracy over a without image feature model to 0.8545 (95% CI = 0.8401-0.8689, p-value < 0.02). This model demonstrated significant enhancement compared to the model using PPI and 18F-FDG PET/CT derived from WGCNA (p-value < 0.02), underscoring the critical role of metastasis-related genes in prediction model. The enhanced predictive capability of the lymph node metastasis prediction GNN model for NSCLC, achieved through the integration of comprehensive image features with genomic data, demonstrates promise for clinical implementation.
Keywords: 18F-FDG PET; CT; GNN; NSCLC; protein–protein interaction; radiogenomics.
Conflict of interest statement
The authors declare no conflicts of interest.
Figures
Similar articles
-
Estimation of an Image Biomarker for Distant Recurrence Prediction in NSCLC Using Proliferation-Related Genes.Int J Mol Sci. 2023 Feb 1;24(3):2794. doi: 10.3390/ijms24032794. Int J Mol Sci. 2023. PMID: 36769108 Free PMC article.
-
An [18F]FDG PET/3D-ultrashort echo time MRI-based radiomics model established by machine learning facilitates preoperative assessment of lymph node status in non-small cell lung cancer.Eur Radiol. 2024 Jan;34(1):318-329. doi: 10.1007/s00330-023-09978-2. Epub 2023 Aug 2. Eur Radiol. 2024. PMID: 37530809
-
Non-invasive Prediction of Lymph Node Metastasis in NSCLC Using Clinical, Radiomics, and Deep Learning Features From 18F-FDG PET/CT Based on Interpretable Machine Learning.Acad Radiol. 2025 Mar;32(3):1645-1655. doi: 10.1016/j.acra.2024.11.037. Epub 2024 Dec 10. Acad Radiol. 2025. PMID: 39665892
-
Predictive Value of 18F-Fluorodeoxyglucose Positron Emission Tomography or Positron Emission Tomography/Computed Tomography for Assessment of Occult Lymph Node Metastasis in Non-Small Cell Lung Cancer.Oncology. 2021;99(2):96-104. doi: 10.1159/000509988. Epub 2020 Sep 25. Oncology. 2021. PMID: 32980838
-
Predictive value of 18F-fluorodeoxyglucose positron emission tomography/computed tomography for PD-L1 expression in non-small cell lung cancer: A systematic review and meta-analysis.Thorac Cancer. 2020 Nov;11(11):3260-3268. doi: 10.1111/1759-7714.13664. Epub 2020 Sep 20. Thorac Cancer. 2020. PMID: 32951338 Free PMC article.
Cited by
-
From Images to Genes: Radiogenomics Based on Artificial Intelligence to Achieve Non-Invasive Precision Medicine in Cancer Patients.Adv Sci (Weinh). 2025 Jan;12(2):e2408069. doi: 10.1002/advs.202408069. Epub 2024 Nov 13. Adv Sci (Weinh). 2025. PMID: 39535476 Free PMC article. Review.
-
Radiogenomics: bridging the gap between imaging and genomics for precision oncology.MedComm (2020). 2024 Sep 9;5(9):e722. doi: 10.1002/mco2.722. eCollection 2024 Sep. MedComm (2020). 2024. PMID: 39252824 Free PMC article. Review.
-
Application of Chest CT Imaging Feature Model in Distinguishing Squamous Cell Carcinoma and Adenocarcinoma of the Lung.Cancer Manag Res. 2024 Jun 4;16:547-557. doi: 10.2147/CMAR.S462951. eCollection 2024. Cancer Manag Res. 2024. PMID: 38855330 Free PMC article.
-
Genomic profiling of NSCLC tumors with the TruSight oncology 500 assay provides broad coverage of clinically actionable genomic alterations and detection of known and novel associations between genomic alterations, TMB, and PD-L1.Front Oncol. 2024 Nov 27;14:1473327. doi: 10.3389/fonc.2024.1473327. eCollection 2024. Front Oncol. 2024. PMID: 39664186 Free PMC article.
References
-
- Matsuda A., Matsuda T., Shibata A., Katanoda K., Sobue T., Nishimoto H. Cancer incidence and incidence rates in Japan in 2008: A study of 25 population-based cancer registries for the Monitoring of Cancer Incidence in Japan (MCIJ) project. Jpn. J. Clin. Oncol. 2014;44:388–396. doi: 10.1093/jjco/hyu003. - DOI - PubMed
MeSH terms
Substances
Grants and funding
LinkOut - more resources
Full Text Sources
Medical
