. 2024 Jan 13;25(2):1021.
doi: 10.3390/ijms25021021.

Comparative Transcriptomic Analysis of Cerebellar Astrocytes across Developmental Stages and Brain Regions

Affiliations

Comparative Transcriptomic Analysis of Cerebellar Astrocytes across Developmental Stages and Brain Regions

Wookbong Kwon et al. Int J Mol Sci. .

Abstract

Astrocytes are the most abundant glial cell type in the central nervous system, and they play a crucial role in normal brain function. While gliogenesis and glial differentiation occur during perinatal cerebellar development, the processes that occur during early postnatal development remain obscure. In this study, we conducted transcriptomic profiling of postnatal cerebellar astrocytes at postnatal days 1, 7, 14, and 28 (P1, P7, P14, and P28), identifying temporal-specific gene signatures at each specific time point. Comparing these profiles with region-specific astrocyte differentially expressed genes (DEGs) published for the cortex, hippocampus, and olfactory bulb revealed cerebellar-specific gene signature across these developmental timepoints. Moreover, we conducted a comparative analysis of cerebellar astrocyte gene signatures with gene lists from pediatric brain tumors of cerebellar origin, including ependymoma and medulloblastoma. Notably, genes downregulated at P14, such as Kif11 and HMGB2, exhibited significant enrichment across all pediatric brain tumor groups, suggesting the importance of astrocytic gene repression during cerebellar development to these tumor subtypes. Collectively, our studies describe gene expression patterns during cerebellar astrocyte development, with potential implications for pediatric tumors originating in the cerebellum.

Keywords: astrocyte; cerebellum; pediatric brain tumors; postnatal development; transcriptome.


Conflict of interest statement

The authors declare no conflicts of interest.

Figures
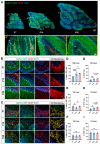
Figure 1
Figure 1
Temporal dynamics of astrocytic marker patterns coincide with cerebellar structural development. (A) Exemplar images of cerebellar sections from Aldh1l1-GFP mice immunostained for GFP (green) and Dapi (blue). Panels (a’c’) (indicating yellow box) show higher magnitude images of each brain. (B) Representative images showing cerebellar cortex, including PC layer and molecular layer, where BGs and VAs are located. 3D rendering images illustrating the GFP-positive fractional area, with BGs highlighted in red and VAs in blue. (C) Representative images showing cerebellar white matter, where FAs are located. 3D rendering images illustrating the GFP-positive fractional area, with VAs highlighted in blue and FAs in yellow. (DF) Graphs showing GFP-positive fractional area for BG, VA, and FA. (GI) Graphs showing GFAP-positive fractional area for BG, VA, and FA (n = 4 for each group, ns (not significant), * p < 0.05, ** p < 0.001, *** p < 0.0001). Data are shown as the mean ± standard error of the mean (SEM).
Figure 2
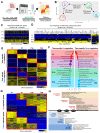
Figure 2
Identification of cerebellar astrocyte gene expression signatures during postnatal development. (A) Schematic of the approach used to investigate astrocyte transcriptome in mouse cerebellum. (B) Principal component analysis plot from RNA-Seq results of cerebellar astrocytes across time points. (C) Heat map showing gene expression changes of developing cerebellar astrocytes compared with adult astrocytes’ shared genes. (D) Heat map and gene lists of the top 50 genes from adult shared genes comparison [10]. (E) Heat map showing time-specific up- or downregulated genes across time points. (F) Top 5 biological GO terms of each time-specific up- or downregulated gene. (G) Heat map showing the genes up- or downregulated from each time point. (H) Top 5 biological GO terms of genes that were up- or downregulated from each time point.
Figure 3
Figure 3
Enriched gene expression signature changes define region-specific astrocytes transcriptome during postnatal brain development. (A) Overview of the approach for investigating region-specific postnatal astrocyte transcriptome from different brain regions [22]. (B) Principal component analysis plot displaying RNA-Seq results of astrocytes from four brain regions across time points. (C,E,G), Heat maps showing DEGs of each time point. (D,F,H) Number of region-specific or globally conserved DEGs across the time points. DEGs of each time point are listed in Table S3. (I) Heat map and gene lists showing globally conserved genes across the time points. (JL) Top 5 biological GO terms of DEGs from four brain regions across the time points.
Figure 4
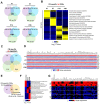
Figure 4
Isolation of CB-specific enriched astrocyte signature genes for postnatal development. (A) Venn diagrams showing cerebellar-specific genes at each time point. (B) Heat map and biological GO terms of cerebellar-specific enriched genes. (C) Venn diagram showing the number of genes conserved across the time points. (D) Heat map and gene list showing cerebellar-specific genes that are conserved across the time points. (E) Venn diagram displaying cerebellar-specific DEGs for development and cerebellar-enriched genes conserved in the adult stage [10]. (F) Biological GO terms and heat map of cerebellar-specific conserved genes. (G) Gene list and heat map of cerebellar-specific conserved genes.
Figure 5
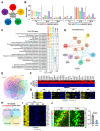
Figure 5
Identification of unique signature genes enriched in brain tumors of cerebellar origin (A) Schematics showing the types of brain tumors that were analyzed in this study. (B) Graph showing the number of genes from comparison analysis of up- or downregulated DEGs from each time point. (C) Top 10 biological GO terms from five types of brain tumors of cerebellar origin. (D) Top 5 KEGG terms of five brain tumor types. (E) Venn diagram displaying the shared or unique gene number from each tumor type. (F) Gene list of cerebellar brain tumor shared genes and heat map showing the expression pattern. (G) Heat maps of cerebellar brain tumor shared genes across the time points. (H) Venn diagram showing the number of genes that were specifically upregulated in the cerebellum at P7. (I) Heat map and gene list of cerebellar-specific P7 upregulated genes. (J) Dynamic Kif11 expression change in astrocytes between P7 and P14 (n = 4 per each group, **** p < 0.0001). Data are shown as the mean ± SEM.

Similar articles

Cited by

  • Medulloblastoma: biology and immunotherapy.
    Poggi A, Reggiani F, Azevedo HS, Raffaghello L, Pereira RC. Poggi A, et al. Front Immunol. 2025 Jul 3;16:1602930. doi: 10.3389/fimmu.2025.1602930. eCollection 2025. Front Immunol. 2025. PMID: 40677711 Free PMC article. Review.

References

    1. Haim L.B., Rowitch D.H. Functional Diversity of Astrocytes in Neural Circuit Regulation. Nat. Rev. Neurosci. 2017;18:31–41. doi: 10.1038/nrn.2016.159. - DOI - PubMed
    1. Abbott N.J., Rönnbäck L., Hansson E. Astrocyte–Endothelial Interactions at the Blood–Brain Barrier. Nat. Rev. Neurosci. 2006;7:41–53. doi: 10.1038/nrn1824. - DOI - PubMed
    1. Dallérac G., Zapata J., Rouach N. Versatile Control of Synaptic Circuits by Astrocytes: Where, When and How? Nat. Rev. Neurosci. 2018;19:729–743. doi: 10.1038/s41583-018-0080-6. - DOI - PubMed
    1. Khakh B.S., Deneen B. The Emerging Nature of Astrocyte Diversity. Annu. Rev. Neurosci. 2019;42:187–207. doi: 10.1146/annurev-neuro-070918-050443. - DOI - PubMed
    1. Cheng Y.-T., Woo J., Deneen B. Sculpting Astrocyte Diversity through Circuits and Transcription. Neuroscientist. 2023;29:445–460. doi: 10.1177/10738584221082620. - DOI - PMC - PubMed