

Identification and Validation of a Prognostic Signature Derived from the Cancer Stem Cells for Oral Squamous Cell Carcinoma
- PMID: 38256104
- PMCID: PMC10816075
- DOI: 10.3390/ijms25021031
Identification and Validation of a Prognostic Signature Derived from the Cancer Stem Cells for Oral Squamous Cell Carcinoma
Abstract
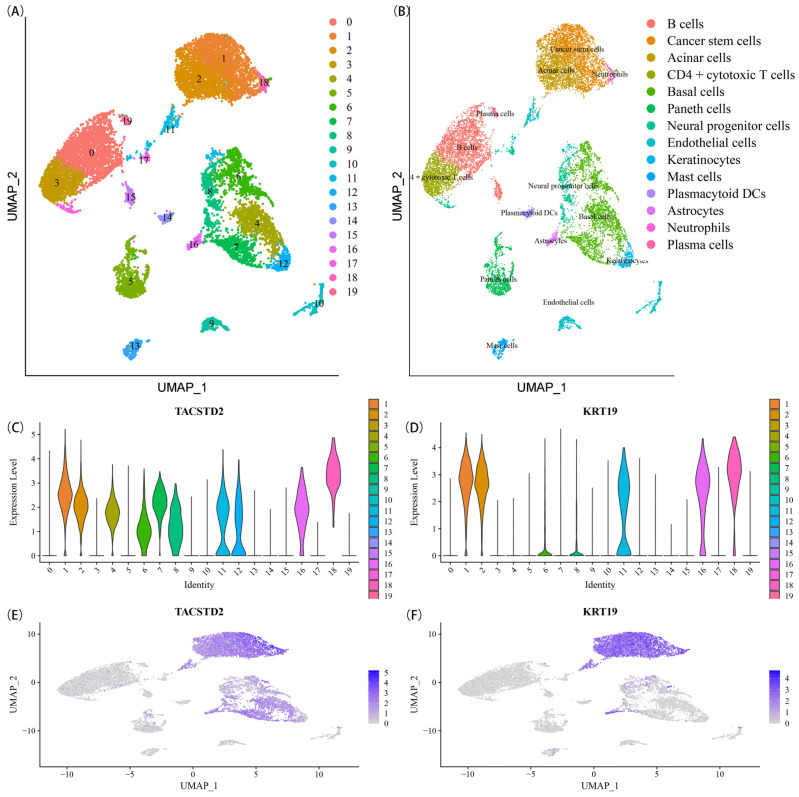
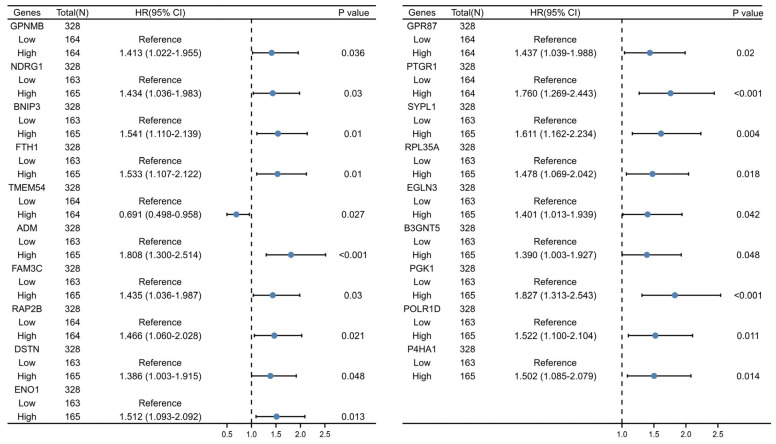
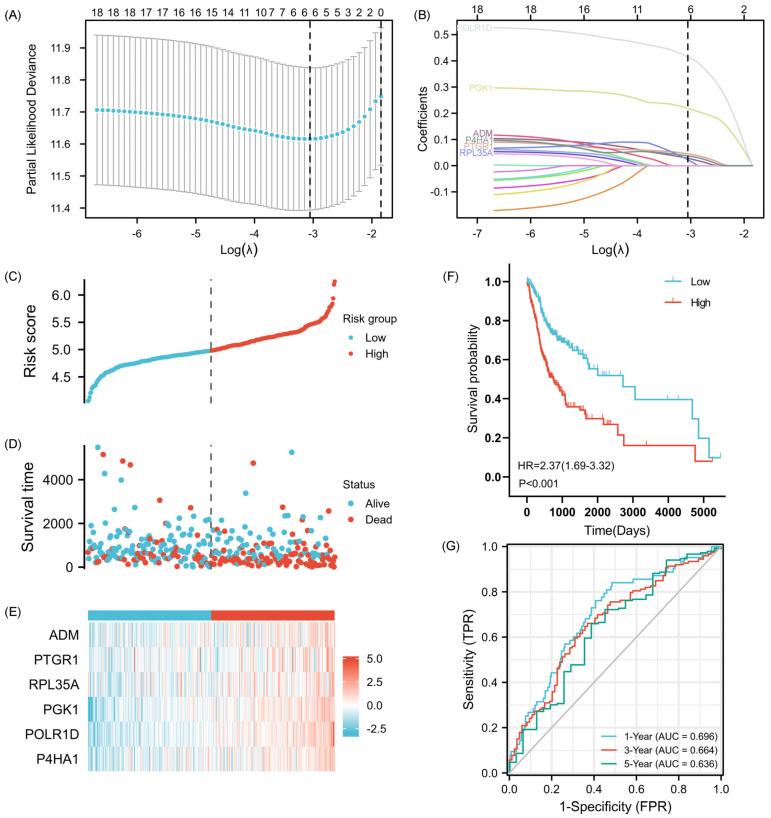
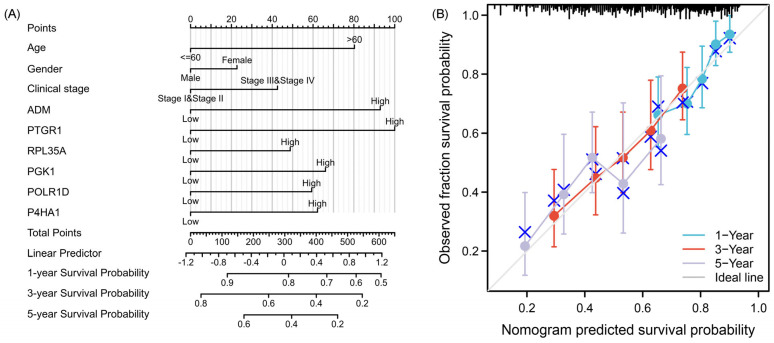
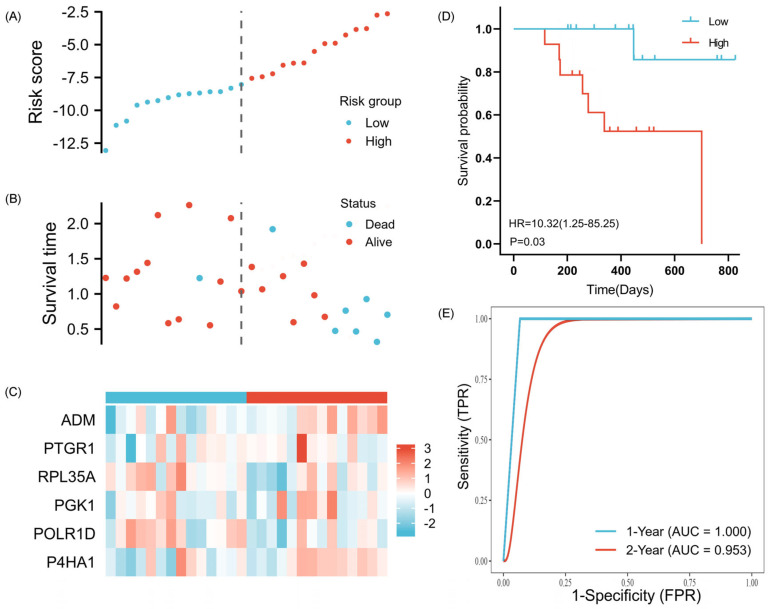
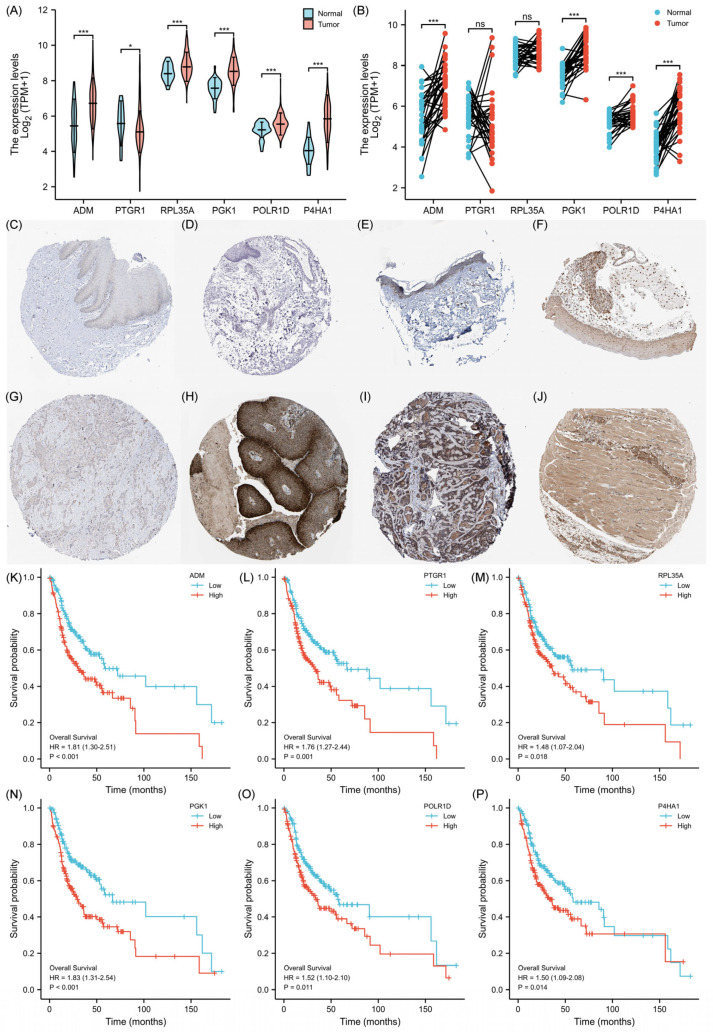
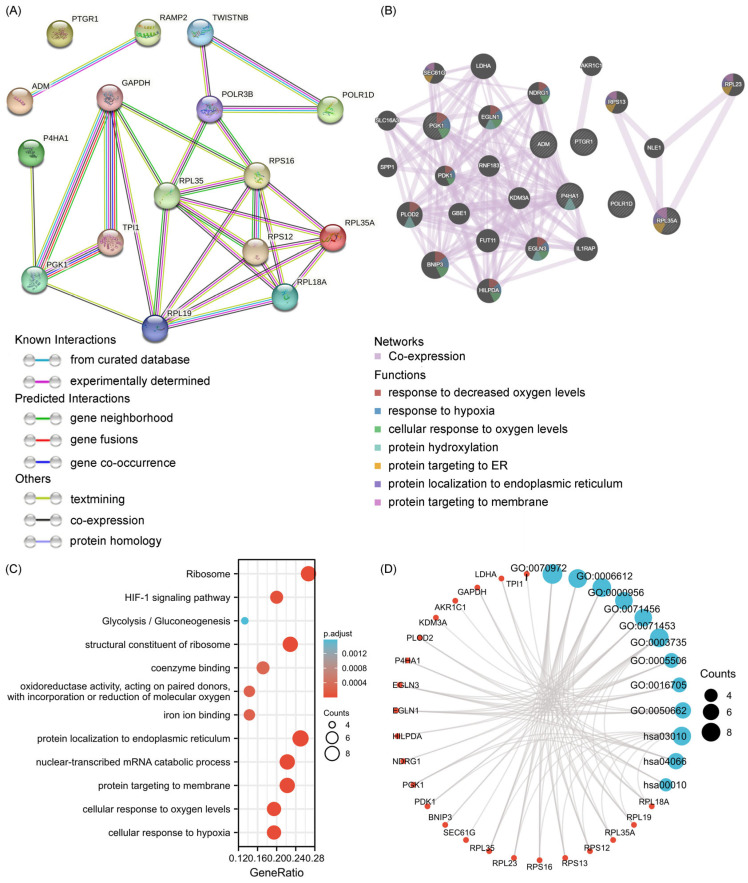
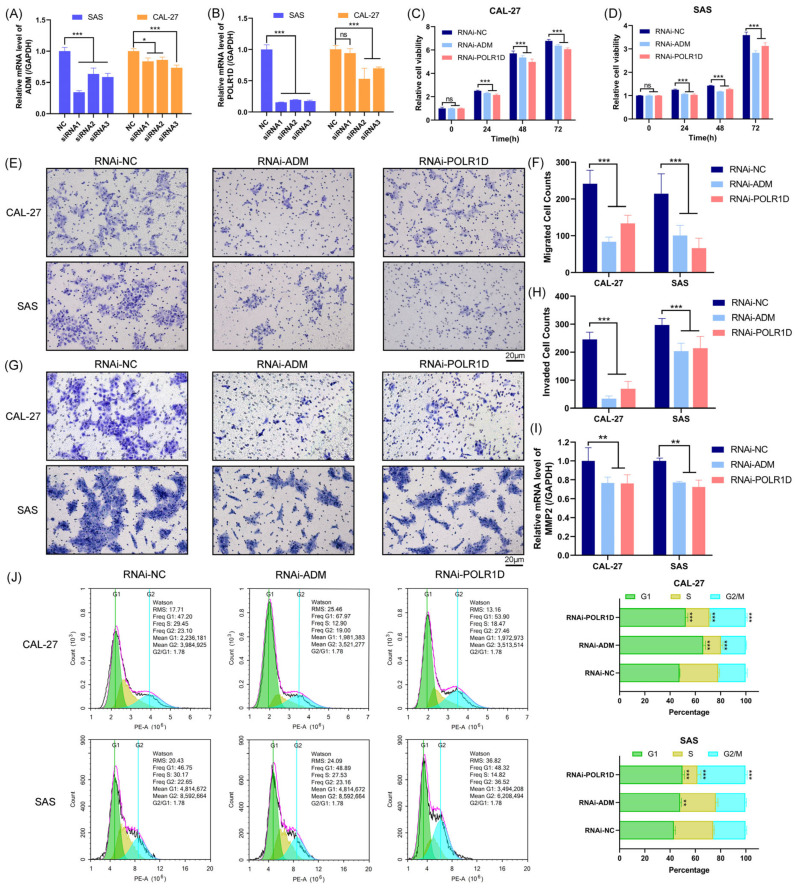
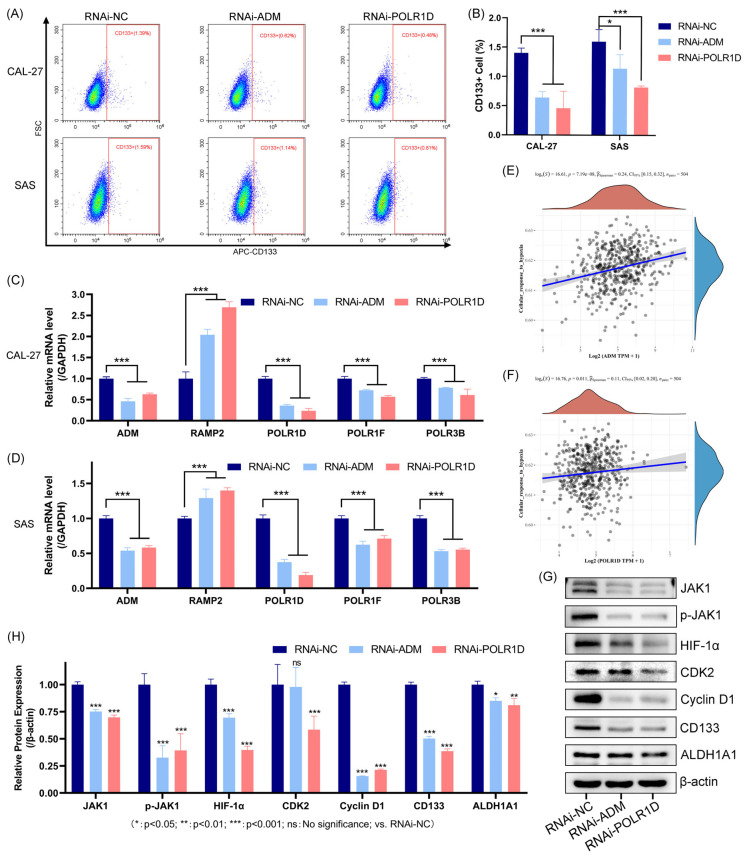
The progression and metastasis of oral squamous cell carcinoma (OSCC) are highly influenced by cancer stem cells (CSCs) due to their unique self-renewal and plasticity. In this study, data were obtained from a single-cell RNA-sequencing dataset (GSE172577) in the GEO database, and LASSO-Cox regression analysis was performed on 1344 CSCs-related genes to establish a six-gene prognostic signature (6-GPS) consisting of ADM, POLR1D, PTGR1, RPL35A, PGK1, and P4HA1. High-risk scores were significantly associated with unfavorable survival outcomes, and these features were thoroughly validated in the ICGC. The results of nomograms, calibration plots, and ROC curves confirmed the good prognostic accuracy of 6-GPS for OSCC. Additionally, the knockdown of ADM or POLR1D genes may significantly inhibit the proliferation, migration, and invasion of OSCC cells through the JAK/HIF-1 pathway. Furthermore, cell-cycle arrest occurred in the G1 phase by suppressing Cyclin D1. In summary, 6-GPS may play a crucial role in the occurrence and development of OSCC and has the potential to be developed further as a diagnostic, therapeutic, and prognostic tool for OSCC.
Keywords: ADM; POLR1D; RNA-sequencing; cancer stem cells; oral squamous cell carcinoma; prognosis signature.
Conflict of interest statement
The authors declare no conflict of interest.
Figures
Similar articles
-
Construction and validation of a metabolic-related genes prognostic model for oral squamous cell carcinoma based on bioinformatics.BMC Med Genomics. 2022 Dec 24;15(1):269. doi: 10.1186/s12920-022-01417-3. BMC Med Genomics. 2022. PMID: 36566175 Free PMC article.
-
Characterization of Cancer Stem Cell Characteristics and Development of a Prognostic Stemness Index Cell-Related Signature in Oral Squamous Cell Carcinoma.Dis Markers. 2021 Nov 9;2021:1571421. doi: 10.1155/2021/1571421. eCollection 2021. Dis Markers. 2021. PMID: 34840626 Free PMC article.
-
MicroRNA-495 confers inhibitory effects on cancer stem cells in oral squamous cell carcinoma through the HOXC6-mediated TGF-β signaling pathway.Stem Cell Res Ther. 2020 Mar 14;11(1):117. doi: 10.1186/s13287-020-1576-3. Stem Cell Res Ther. 2020. PMID: 32171324 Free PMC article.
-
Diagnostic and prognostic role of cancer stem cell biomarkers in oral squamous cell carcinoma; A Systematic Review.J Pak Med Assoc. 2023 Feb;73(Suppl 1)(2):S32-S39. doi: 10.47391/JPMA.AKUS-06. J Pak Med Assoc. 2023. PMID: 36788389
-
The promise of stem cell markers in the diagnosis and therapy of epithelial dysplasia and oral squamous cell carcinoma.J Cell Physiol. 2018 Nov;233(11):8499-8507. doi: 10.1002/jcp.26789. Epub 2018 May 24. J Cell Physiol. 2018. PMID: 29797575 Review.
Cited by
-
Proteogenomic characterisation of primary oral cancer unveils extracellular matrix remodelling and immunosuppressive microenvironment linked to lymph node metastasis.Clin Transl Med. 2025 Mar;15(3):e70261. doi: 10.1002/ctm2.70261. Clin Transl Med. 2025. PMID: 40038875 Free PMC article.
-
SAE1 May Play a Pro-Carcinogenic Role in Pancreatic Adenocarcinoma: A Comprehensive Study Integrating Multiple Pieces of Evidence.IET Syst Biol. 2025 Jan-Dec;19(1):e70017. doi: 10.1049/syb2.70017. IET Syst Biol. 2025. PMID: 40302186 Free PMC article.
-
A POLR1D-regulating single-nucleotide polymorphism as a predictive marker candidate for platinum-based chemotherapy in gastrointestinal cancers.Ther Adv Med Oncol. 2025 Jul 13;17:17588359251355079. doi: 10.1177/17588359251355079. eCollection 2025. Ther Adv Med Oncol. 2025. PMID: 40661991 Free PMC article.
-
A Narrative Review of Prognostic Gene Signatures in Oral Squamous Cell Carcinoma Using LASSO Cox Regression.Biomedicines. 2025 Jan 8;13(1):134. doi: 10.3390/biomedicines13010134. Biomedicines. 2025. PMID: 39857718 Free PMC article. Review.
-
Porphyromonas gingivalis potentiates stem-like properties of oral squamous cell carcinoma by modulating SCD1-dependent lipid synthesis via NOD1/KLF5 axis.Int J Oral Sci. 2025 Feb 28;17(1):15. doi: 10.1038/s41368-024-00342-8. Int J Oral Sci. 2025. PMID: 40016182 Free PMC article.
References
-
- Fan T., Wang X., Zhang S., Deng P., Jiang Y., Liang Y., Jie S., Wang Q., Li C., Tian G., et al. NUPR1 promotes the proliferation and metastasis of oral squamous cell carcinoma cells by activating TFE3-dependent autophagy. Signal Transduct. Target. Ther. 2022;7:130. doi: 10.1038/s41392-022-00939-7. - DOI - PMC - PubMed
MeSH terms
Substances
Grants and funding
- Grant No. 20JR10RA691/Natural Science Foundation of Gansu Province, China
- No. 20JR10RA653/the Open Subject Foundation of Key Laboratory of Dental Maxillofacial Reconstruction and Bio-logical Intelligence Manufacturing, School of Stomatology, Lanzhou University, Gansu Province
- No. 23YFWA0003/the Key Research and Development Program of Gansu Province (International Scientific and Technological Cooperation Category)
- lzujbky-2023-07 and lzujbky-2023-29/the Fundamental Research Funds for the Central Universities
- lzujbky-2022-it15/Lanzhou University Excellent Postgraduate Innovation Program (Supported by the Fundamental Research Funds for the Central Universities)
LinkOut - more resources
Full Text Sources
Medical
Research Materials
Miscellaneous
