. 2024 Jan 16;25(2):1097.
doi: 10.3390/ijms25021097.

Glutathione Reductase Expression and Its Prognostic Significance in Colon Cancer

Affiliations

Glutathione Reductase Expression and Its Prognostic Significance in Colon Cancer

Marlena Brzozowa-Zasada et al. Int J Mol Sci. .

Abstract

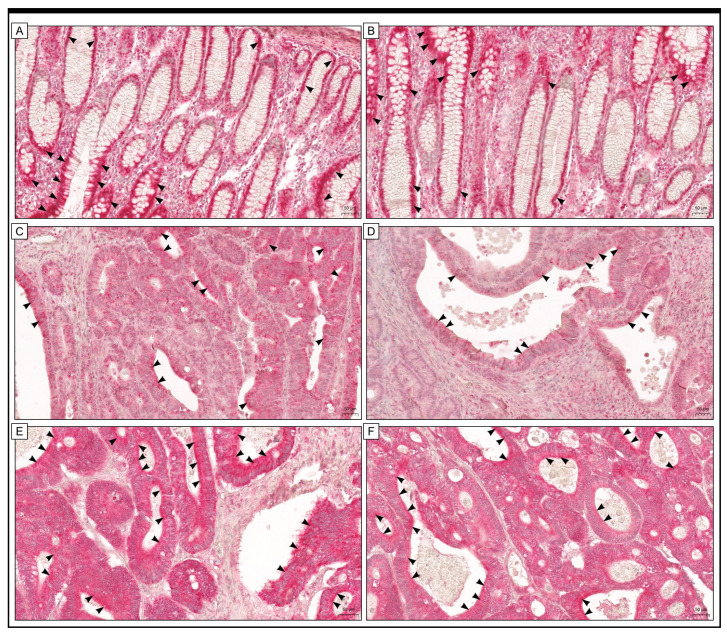
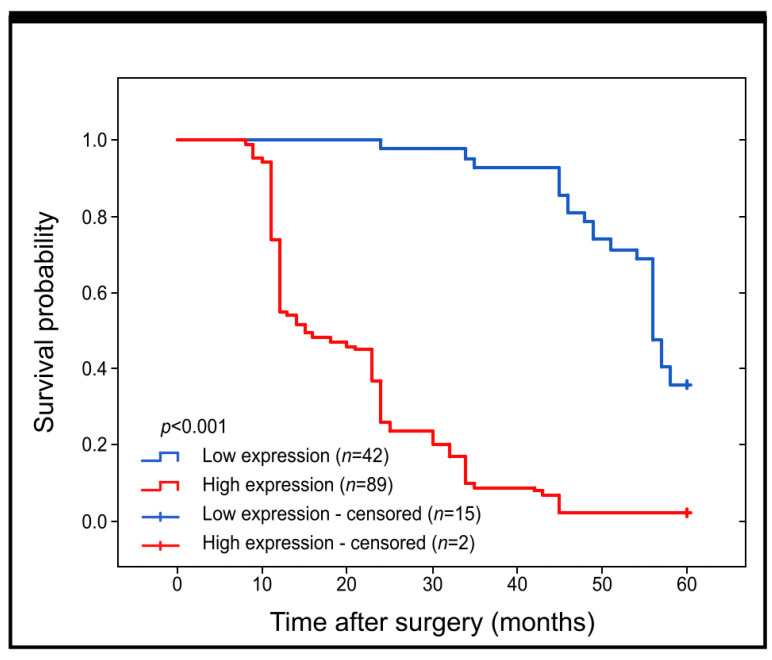
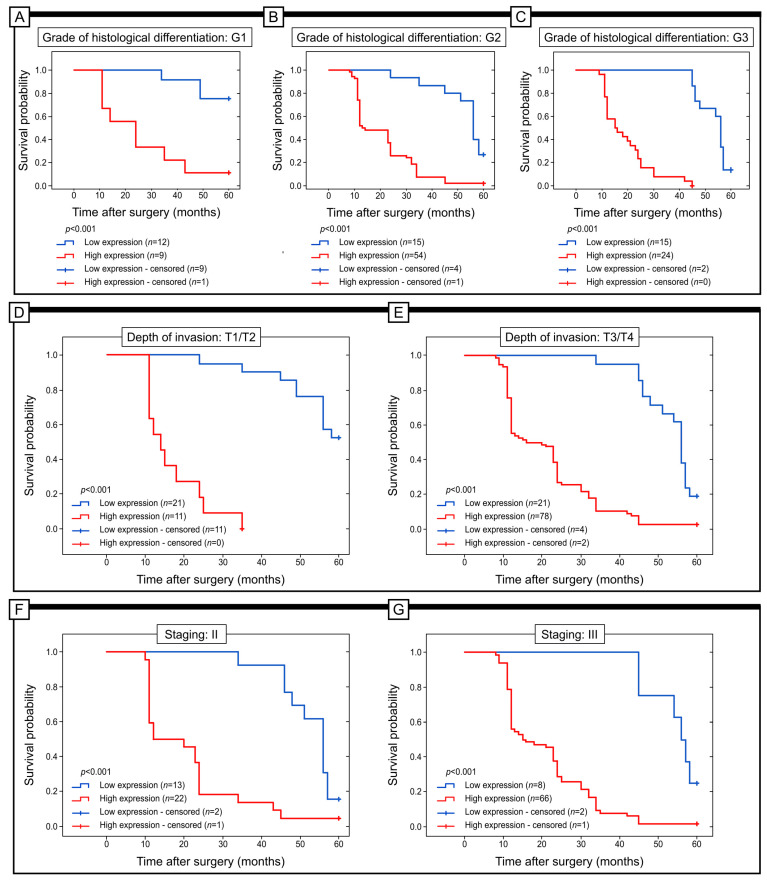
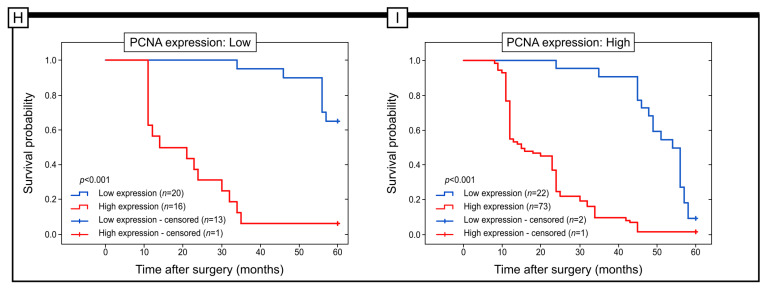
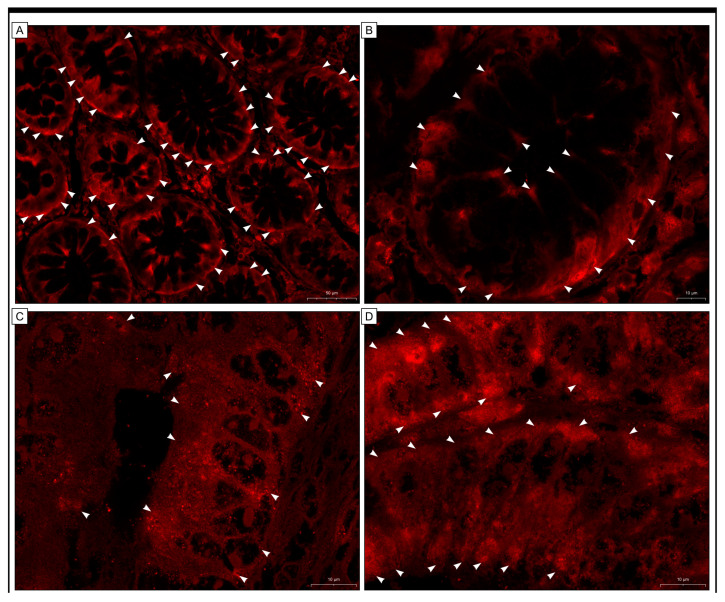
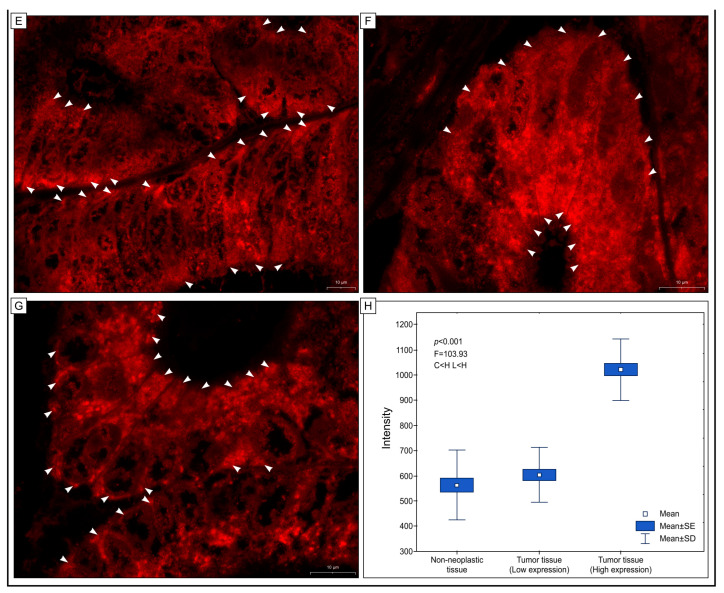
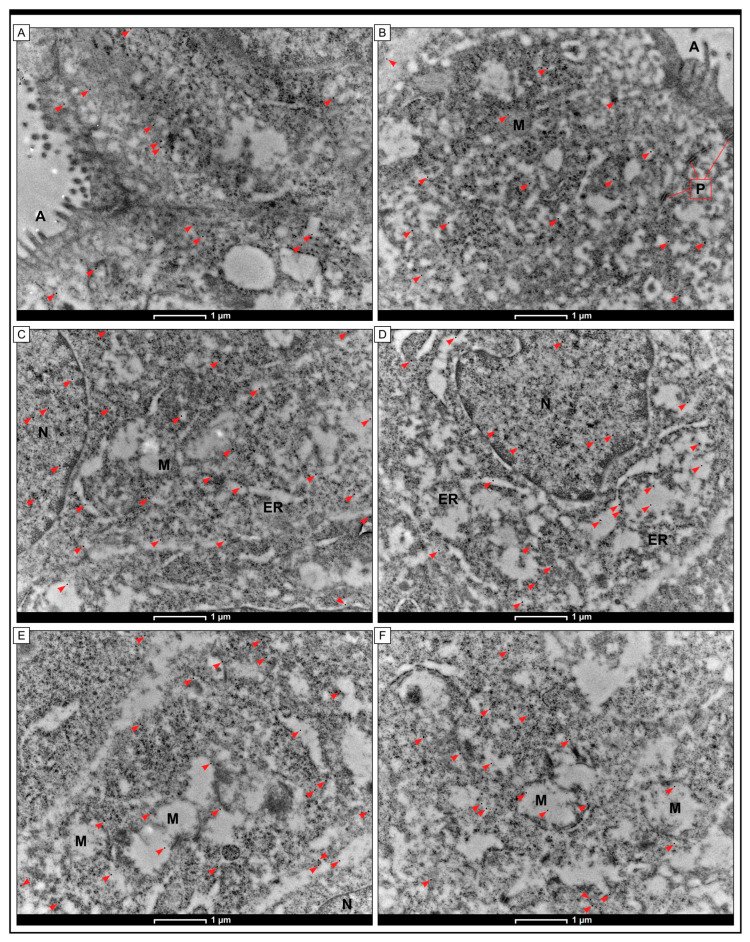
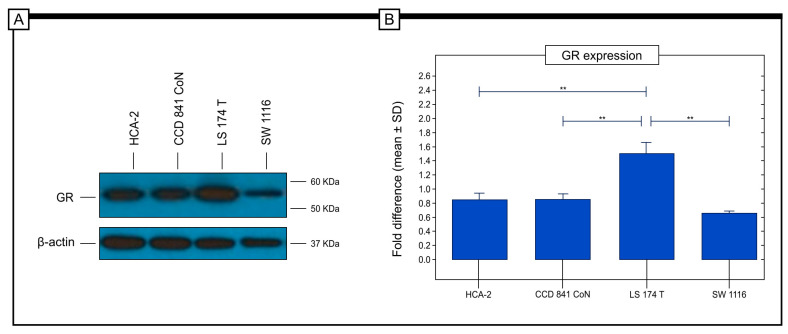
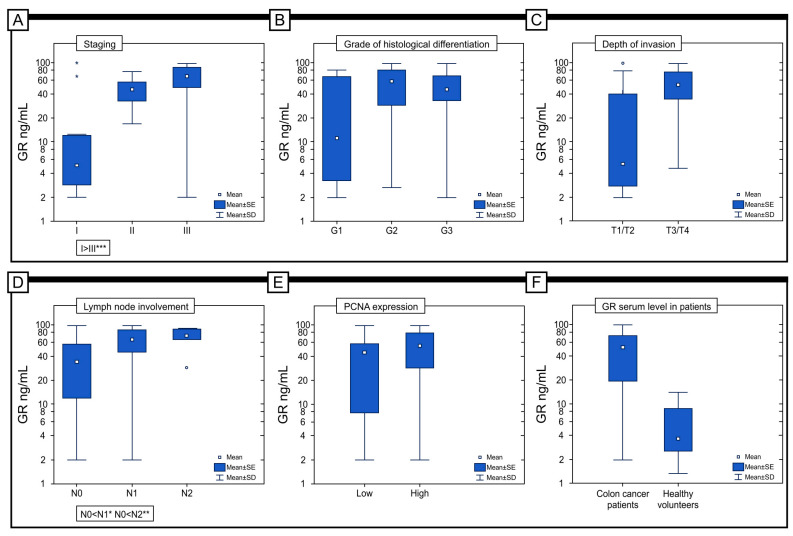
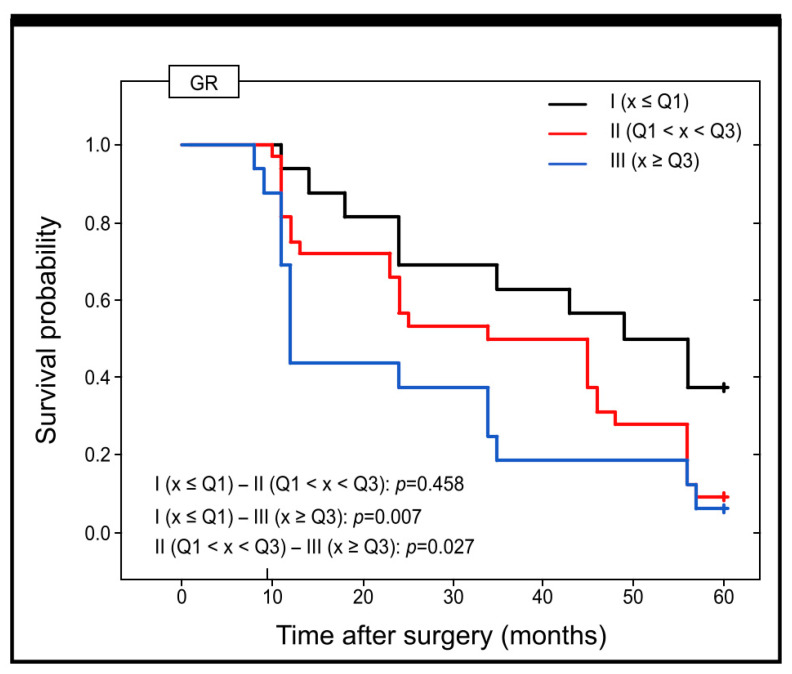
Maintaining a balanced redox state within cells is crucial for the sustenance of life. The process involves continuous cytosolic disulfide reduction reactions to restore oxidized proteins to their reduced thiol forms. There are two main cellular antioxidant pathways-the thioredoxin (Trx) and glutathione (GSH)/glutaredoxin (Grx) systems. In the GSH/Grx system, glutathione reductase (GR; GSR) catalyses the reduction of GSH disulfide (GSSG) to its sulfhydryl form (GSH), which can then further reduce oxidized Grxs. GR is an essential enzyme that helps in maintaining the supply of reduced glutathione-GSH, which is a significant reducing thiol found in most cells and known for its antioxidant properties. Therefore, it can have a significant impact on cancer development. To investigate this further, we performed an immunohistochemical analysis of GR protein expression in colon adenocarcinoma samples collected from patients with primary colon adenocarcinoma (stage I and II) and patients with metastasis to regional lymph nodes (stage III). The results of our study revealed a significant relationship between the immunohistochemical expression of GR and tumour histological grade, depth of invasion, regional lymph node involvement, staging, and PCNA immunohistochemical expression. It was found that 95% of patients with stage I had low levels of GR expression, whereas 89% of patients with stage III had high levels of immunohistochemical expression. A high level of expression was also detected in the patients with stage II of the disease, where almost 63% were characterized by a high expression of GR. The Western blot method revealed that the highest level of expression was found in the LS 174T cell line, which corresponds to stage II. The results of our study indicate that the immunohistochemical expression of GR may act as an independent prognostic factor associated with colon adenocarcinoma patients' prognosis.

Keywords: ELISA; Western blot; chromosomal instability (CIN); colorectal cancer; glutaredoxin; glutathione system (GSH); oxidative stress; prognostic factor; redox homeostasis.


Conflict of interest statement

The authors declare no conflicts of interest.

Figures

Figure 1
Figure 1
The immunohistochemical expression of GR was detected in adjacent non-cancerous tissue margins (A,B) and colon adenocarcinoma tissue (CF). Black arrows show examples of cells in which immunohistochemical expression of the protein was detected, and a positive staining reaction (in red) indicates GR protein expression is visible. The scale bar is 50 µm for (AF).
Figure 2
Figure 2
Kaplan–Meier curves for comparison of survival probability for patients with high and low levels of GR immunohistochemical expression in colon adenocarcinoma samples.
Figure 3
Figure 3
Kaplan–Meier curves were used to analyse the data on the immunohistochemical expression of GR protein in colon adenocarcinoma patients. The analysis was conducted through a log-rank test to compare patients with high versus low levels of GR expression. The results were presented for patients with different grades of differentiation (G1, G2 and G3) (AC), depth of invasion (T1/T2 and T3/T4) (D,E), and different stages (II and III) (F,G) and immunohistochemical expression of PCNA (low and high expression) (H,I).
Figure 3
Figure 3
Kaplan–Meier curves were used to analyse the data on the immunohistochemical expression of GR protein in colon adenocarcinoma patients. The analysis was conducted through a log-rank test to compare patients with high versus low levels of GR expression. The results were presented for patients with different grades of differentiation (G1, G2 and G3) (AC), depth of invasion (T1/T2 and T3/T4) (D,E), and different stages (II and III) (F,G) and immunohistochemical expression of PCNA (low and high expression) (H,I).
Figure 4
Figure 4
These figures illustrate the expression of GR protein in colon adenocarcinoma tissue (CG) and non-carcinoma adjacent tissue (A,B) using immunofluorescence. A red fluorescent signal of fluctuating levels was seen in cells located within non-cancerous mucosa (A,B)—arrowheads show expression in the cytoplasm of colonocytes and cancer cells (CG). In several cancer cells, the fluorescent signals showing the presence of GR were located in the cytoplasm of the apical parts of the cells, whereas in others, intense fluorescence was observed throughout the cytoplasm of the cells (arrowheads) or inside the nuclei (arrows). (H) ANOVA test results show differences in the intensity of the red signal representing the presence of GR between the groups tested: C < H, L < H—differences in intensity between the groups; C—colon tissue free of any pathological abnormalities, L—adenocarcinoma samples with low expression of GR, H—adenocarcinoma tissue exhibiting high expression of GR.
Figure 4
Figure 4
These figures illustrate the expression of GR protein in colon adenocarcinoma tissue (CG) and non-carcinoma adjacent tissue (A,B) using immunofluorescence. A red fluorescent signal of fluctuating levels was seen in cells located within non-cancerous mucosa (A,B)—arrowheads show expression in the cytoplasm of colonocytes and cancer cells (CG). In several cancer cells, the fluorescent signals showing the presence of GR were located in the cytoplasm of the apical parts of the cells, whereas in others, intense fluorescence was observed throughout the cytoplasm of the cells (arrowheads) or inside the nuclei (arrows). (H) ANOVA test results show differences in the intensity of the red signal representing the presence of GR between the groups tested: C < H, L < H—differences in intensity between the groups; C—colon tissue free of any pathological abnormalities, L—adenocarcinoma samples with low expression of GR, H—adenocarcinoma tissue exhibiting high expression of GR.
Figure 5
Figure 5
The presence of GR was confirmed in cells from healthy mucosa, where they were visible in the apical parts of the cells, mostly within the mitochondria (A,B). In cancer cells, the localisation of the GR antigen was mainly associated with the cytoplasm and the nucleus (N). In the nucleus of neoplastic cells, granules indicating the presence of GR were found to be loosely distributed in the nuclear stroma and close to the nuclear membrane (C,D). In the cytoplasm, electron-dense black granules associated with the presence of GR were mainly localised in the mitochondria (M), where their presence was seen close to the mitochondrial membrane or in the matrix. Their presence was also detected in the cisternae of the endoplasmic reticulum (ER) (E,F). The scale bar is 1 µm for (AF). Red arrowheads indicate the presence of electron-dense granules in cellular compartments, consistent with GR antigen.
Figure 6
Figure 6
In vitro study of the expression of GR in colorectal cancer cell lines that represent a different type of colorectal cancer. The analysis revealed that the LS 174T cell line had the highest level of GR protein expression. A similar level of GR expression was observed in the SW1116 cell line, HCA-2 cell line and CCD 841 CoN (A). Significant differences in the levels of GR protein expression were observed between the HCA-2 cells and the LS 174T, between CCD 841 CoN and LS174T, and between SW 1116 and LS 174T. Statistical significance was determined using an independent-sample t-test. Data are shown as mean ± SD of values of three measurements in each group. In all figures, p-value of statistical significance is ** p < 0.01 (B).
Figure 7
Figure 7
The serum GR levels in patients with colorectal adenocarcinoma were compared regarding staging (A), grade of histological differentiation (B), depth of invasion (C), lymph node involvement (D), and immunohistochemical expression of PCNA protein (E). (F) The concentration of the serum level in patients with colorectal adenocarcinoma and control subjects. * p < 0.05, ** p < 0.01, *** p < 0.001, °: statistical outliers.
Figure 8
Figure 8
Survival probabilities and their transitions during the 60-month follow-up period for patients with different levels of serum GR in colorectal adenocarcinoma patients are shown in Kaplan–Meier curves.

Similar articles

Cited by

References

    1. Lewandowska A., Rudzki G., Lewandowski T., Stryjkowska-Góra A., Rudzki S. Risk Factors for the Diagnosis of Colorectal Cancer. Cancer Control. 2022;29:10732748211056692. doi: 10.1177/10732748211056692. - DOI - PMC - PubMed
    1. Siegel R.L., Wagle N.S., Cercek A., Smith R.A., Jemal A. Colorectal cancer statistics, 2023. CA Cancer J. Clin. 2023;73:233–254. doi: 10.3322/caac.21772. - DOI - PubMed
    1. Stoffel E.M., Murphy C.C. Epidemiology and Mechanisms of the Increasing Incidence of Colon and Rectal Cancers in Young Adults. Gastroenterology. 2020;158:341–353. doi: 10.1053/j.gastro.2019.07.055. - DOI - PMC - PubMed
    1. Healy M.A., Thirumurthi S., You Y.N. Screening high-risk populations for colon and rectal cancers. J. Surg. Oncol. 2019;120:858–863. doi: 10.1002/jso.25648. - DOI - PubMed
    1. Pino M.S., Chung D.C. The chromosomal instability pathway in colon cancer. Gastroenterology. 2010;138:2059–2072. doi: 10.1053/j.gastro.2009.12.065. - DOI - PMC - PubMed

LinkOut - more resources