. 2024 Jan 17;25(2):1115.
doi: 10.3390/ijms25021115.

Identification and Expression Analysis of the Nucleotidyl Transferase Protein (NTP) Family in Soybean (Glycine max) under Various Abiotic Stresses

Affiliations

Identification and Expression Analysis of the Nucleotidyl Transferase Protein (NTP) Family in Soybean (Glycine max) under Various Abiotic Stresses

Liqing Kang et al. Int J Mol Sci. .

Abstract

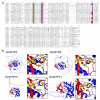
Nucleotidyl transferases (NTPs) are common transferases in eukaryotes and play a crucial role in nucleotide modifications at the 3' end of RNA. In plants, NTPs can regulate RNA stability by influencing 3' end modifications, which in turn affect plant growth, development, stress responses, and disease resistance. Although the functions of NTP family members have been extensively studied in Arabidopsis, rice, and maize, there is limited knowledge about NTP genes in soybeans. In this study, we identified 16 members of the NTP family in soybeans, including two subfamilies (G1 and G2) with distinct secondary structures, conserved motifs, and domain distributions at the protein level. Evolutionary analysis of genes in the NTP family across multiple species and gene collinearity analysis revealed a relatively conserved evolutionary pattern. Analysis of the tertiary structure of the proteins showed that NTPs have three conserved aspartic acids that bind together to form a possible active site. Tissue-specific expression analysis indicated that some NTP genes exhibit tissue-specific expression, likely due to their specific functions. Stress expression analysis showed significant differences in the expression levels of NTP genes under high salt, drought, and cold stress. Additionally, RNA-seq analysis of soybean plants subjected to salt and drought stress further confirmed the association of soybean NTP genes with abiotic stress responses. Subcellular localization experiments revealed that GmNTP2 and GmNTP14, which likely have similar functions to HESO1 and URT1, are located in the nucleus. These research findings provide a foundation for further investigations into the functions of NTP family genes in soybeans.

Keywords: Glycine max; RNA-seq; abiotic stress; gene expression; nucleotidyl transferase protein (NTP); subcellular localization.


Conflict of interest statement

The authors declare no conflict of interest.

Figures
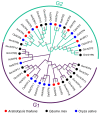
Figure 1
Figure 1
Phylogenetic analysis of GmNTP proteins. Red circles represent the NTP family members of Arabidopsis thaliana; black circles represent the NTP family members of Glycine max; blue circles represent the NTP family members of Oryza sativa. The resulting NTP genes were categorized into two distinct groups (G1/G2), G1 is distinguished by purple and G2 by green on the evolutionary tree..
Figure 2
Figure 2
Chromosomal location and collinearity analysis of GmNTP in soybean. (A) Locations of GmNTP genes in twenty chromosomes of soybean. The protein sequences encoded by straight-line junction genes are more than 70% similar. (B) Genome-wide collinearity analysis of NTP in the soybean genome. Paralogous genes were linked by red lines represent. The inner circular heatmap represents gene density, red represents high density and blue represents low density. (C) Genome-wide collinearity analysis of NTP genes between the soybean (blue), Arabidopsis (red), and rice (yellow) genomes. Blue lines represent orthologous genes; red triangles represent different gene pairs.
Figure 3
Figure 3
Conserved motifs, secondary structure, and conserved domain analysis of NTP proteins in soybean. (A) Conserved motifs of NTP proteins. Fifteen motifs are displayed in different colors. (B) Secondary structures of NTP proteins. Different colors represent different secondary structures. (C) Conserved domain of the NTP protein. Green represents the NTP_transf_2 domain, and yellow represents the PAP_assoc domain.
Figure 4
Figure 4
Multi sequence alignment and tertiary structure analysis of GmNTP proteins. (A) Conserved amino acid sequence analysis of the core domain of GmNTP family. The red pentagrams mark the conserved sites of NTP_transf_2 (PF01909) and the blue triangle mark the potential site with uridine function in plants. Different colors represents different amino acids. (B) Tertiary structure prediction and analysis of GmNTP2/9/10/14 proteins. The possible active centers formed by three conserved aspartates are shown in the detailed view. The arrow points to a conserved SCD structure.
Figure 5
Figure 5
Protein interacting network and functional analysis of GmNTPs. (A) Protein interaction networks in GmNTPs. The lines represent possible interactions. The different color represent the different cellular component of the GO enrichment results such as green means those genes is involved in RNA 3-end processing (B) GO enrichment shown as dot bubbles. A total of 17 GO terms were significantly enriched, covering biological processes, cellular components, and molecular functions. The smaller the circle, the fewer the number of genes.
Figure 6
Figure 6
Cis-acting elements and gene structure analysis of NTP genes in soybean. (A) Cis-acting elements in the promotors of NTP genes. Different colors represent different cis-acting elements. (B) Gene structures of NTP genes. The yellow and green boxes represent the coding DNA sequence (CDS) and untranslated region (UTR), respectively.
Figure 7
Figure 7
Tissue-specific expression of GmNTP genes. (A) Expression data for 14 tissues, including root, nodule (underground tissues), leaf, flower, pod-shell 10 days after flowering (DAF), pod-shell 14 DAF, one cm pod (aerial tissues), and different stages of seed development (underground). (B) Expression data for GmNTP genes at various developmental stages, including root, stem, leaf, flower, seeding (vegetative stages), buds, and different stages of seed development (reproductive stages).
Figure 8
Figure 8
Sample correlation and principal component analysis (PCA) analysis of all transcripts and expression analysis of GmNTP genes under abiotic stresses. (A,B) Sample correlation analysis of the control and experimental groups. Gm_0h, wild-type soybeans; GmS6h, soybeans under salt stress for 6 h; GmD6h, soybeans under drought stress for 6 h. (C) PCA plot of transcriptome results. (D) Expression heatmap of GmNTP genes under salt or drought stress. The different symbols represent the level of significant difference, *, p < 0.05; **, p < 0.01.
Figure 9
Figure 9
The differential expression analysis of GmNTP genes under salt, drought, and low-temperature stresses. Heat map illustrating the changes in expression of GmNTP genes identified by qRT-PCR under abiotic stress. NA means did not detected the expression by qRT-PCR. The data are shown as the mean ± SD of three independent biological replicates. The different symbols represent the level of significant difference, *, p < 0.05; **, p < 0.01.
Figure 10
Figure 10
Analysis of the subcellular localization of GmNTP2 and GmNTP14. GmNTP2-GFP and GmNTP14-GFP colocalized with NLS-mCherry, which is a marker of nuclear localization. For each construct, 10–20 cells were analyzed, and a common nuclear location pattern was observed. However, GFP fluorescence was also observed in the cytoplasm. Scale bar, 20 μm.

Similar articles

Cited by

References

    1. Yang H., Song J., Yue L., Mo X., Song J., Mo B. Identification and expression profiling of Oryza sativa nucleotidyl transferase protein (NTP) genes under various stress conditions. Gene. 2017;628:93–102. doi: 10.1016/j.gene.2017.06.038. - DOI - PubMed
    1. Chou M., Han B.W., Hsiao C., Zamore P.D., Weng Z., Hung J. Tailor: A computational framework for detecting non-templated tailing of small silencing RNAs. Nucleic Acids Res. 2015;43:e109. doi: 10.1093/nar/gkv537. - DOI - PMC - PubMed
    1. Knouf E.C., Wyman S.K., Tewari M. The human TUT1 nucleotidyl transferase as a global regulator of microRNA abundance. PLoS ONE. 2013;8:e69630. doi: 10.1371/journal.pone.0069630. - DOI - PMC - PubMed
    1. Ohnishi Y., Totoki Y., Toyoda A., Watanabe T., Yamamoto Y., Tokunaga K., Sakaki Y., Sasaki H., Hohjoh H. Small RNA class transition from siRNA/piRNA to miRNA during pre-implantation mouse development. Nucleic Acids Res. 2010;38:5141–5151. doi: 10.1093/nar/gkq229. - DOI - PMC - PubMed
    1. Song J.B., Gao S., Sun D., Li H., Shu X.X., Yang Z.M. miR394 and LCR are involved in Arabidopsis salt and drought stress responses in an abscisic acid-dependent manner. BMC Plant Biol. 2013;13:210. doi: 10.1186/1471-2229-13-210. - DOI - PMC - PubMed

LinkOut - more resources