

Influence of Seasonality and Public-Health Interventions on the COVID-19 Pandemic in Northern Europe
- PMID: 38256468
- PMCID: PMC10816378
- DOI: 10.3390/jcm13020334
Influence of Seasonality and Public-Health Interventions on the COVID-19 Pandemic in Northern Europe
Abstract
Background: Most government efforts to control the COVID-19 pandemic revolved around non-pharmaceutical interventions (NPIs) and vaccination. However, many respiratory diseases show distinctive seasonal trends. In this manuscript, we examined the contribution of these three factors to the progression of the COVID-19 pandemic.
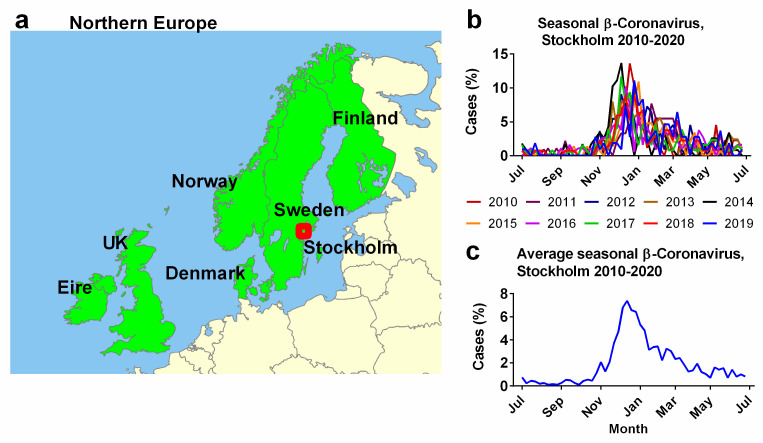
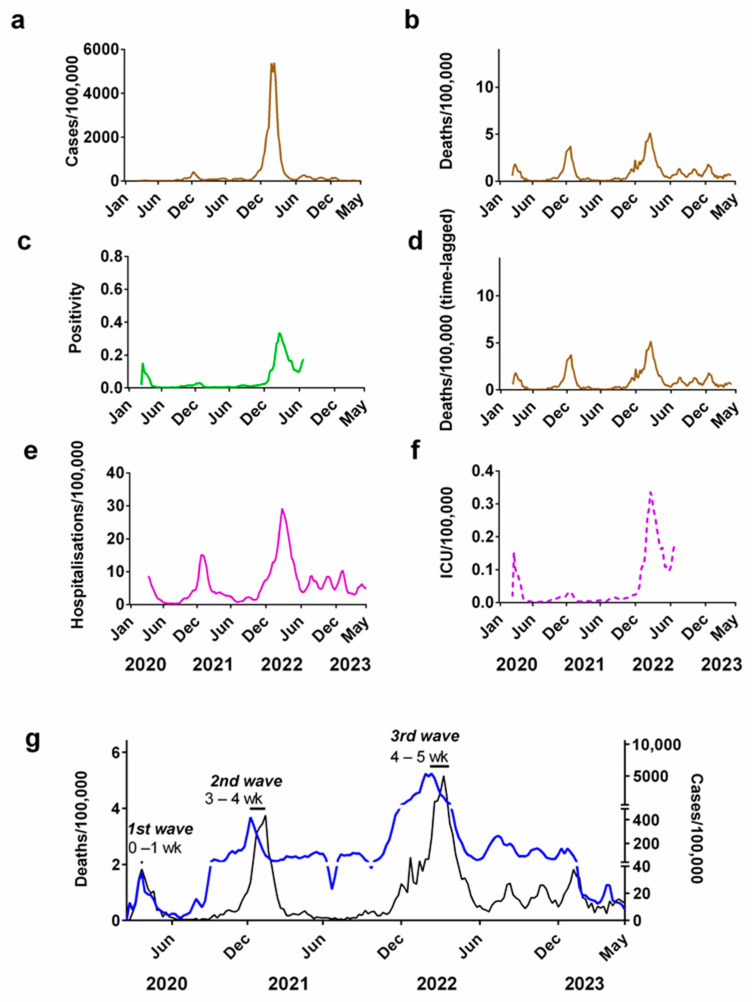
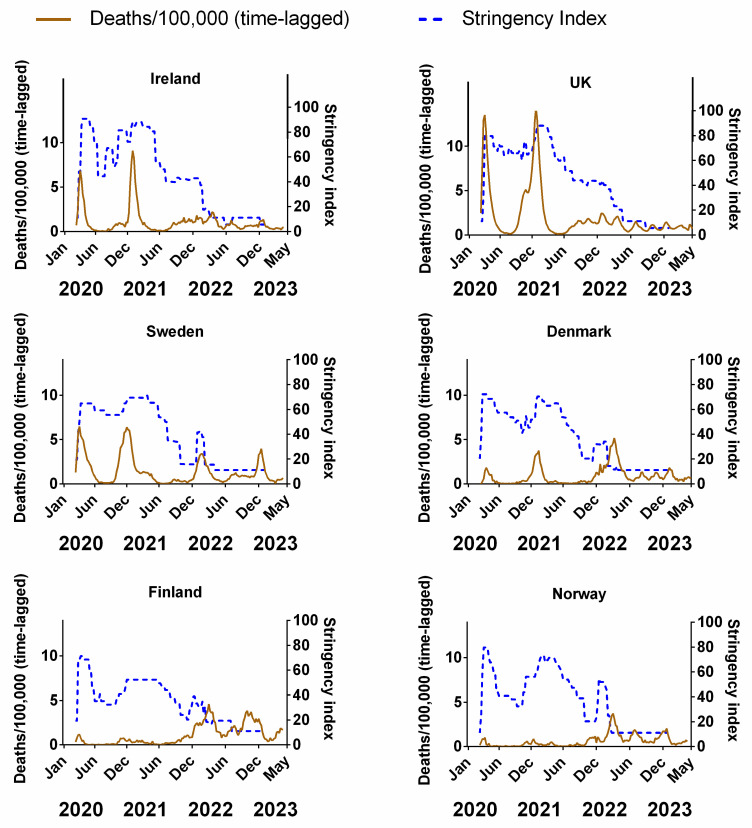
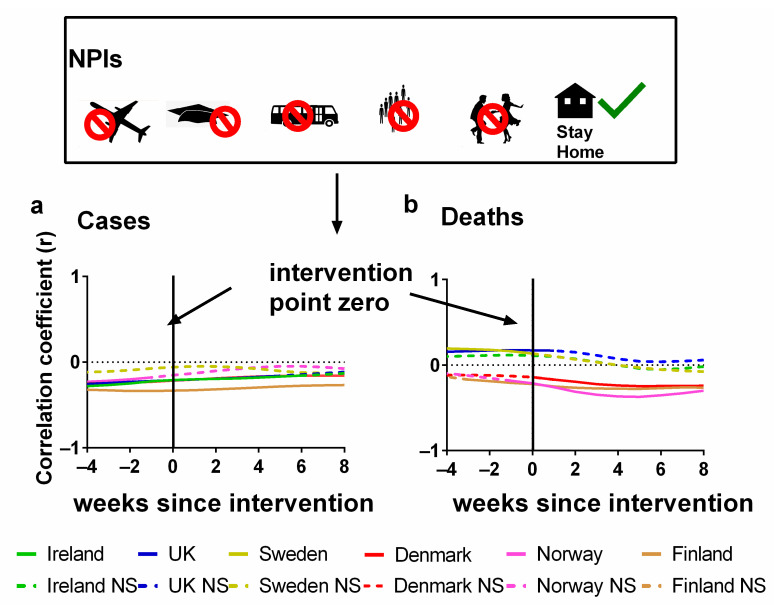
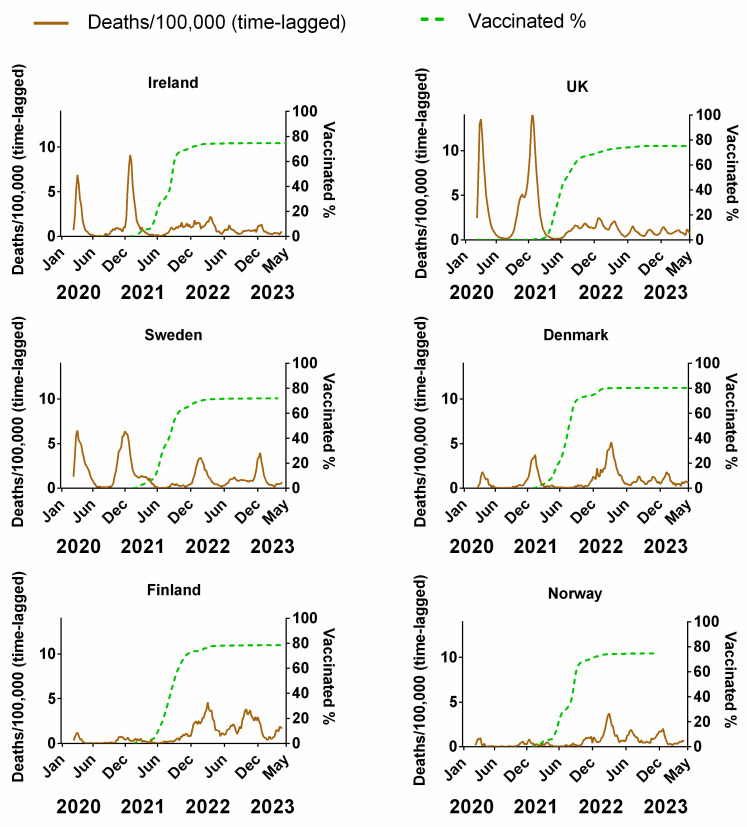
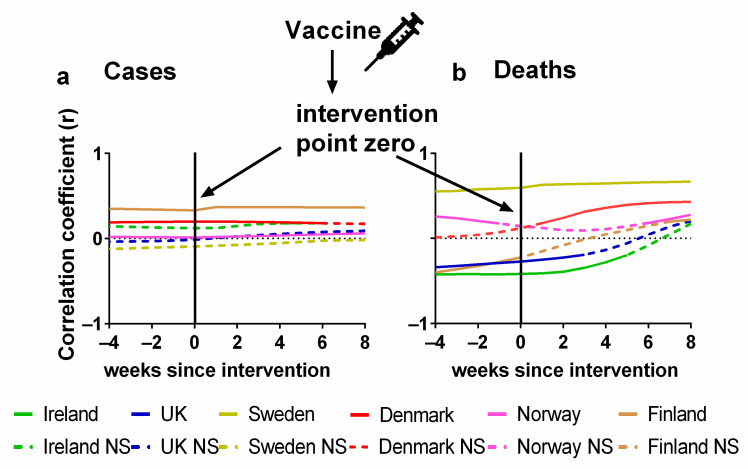
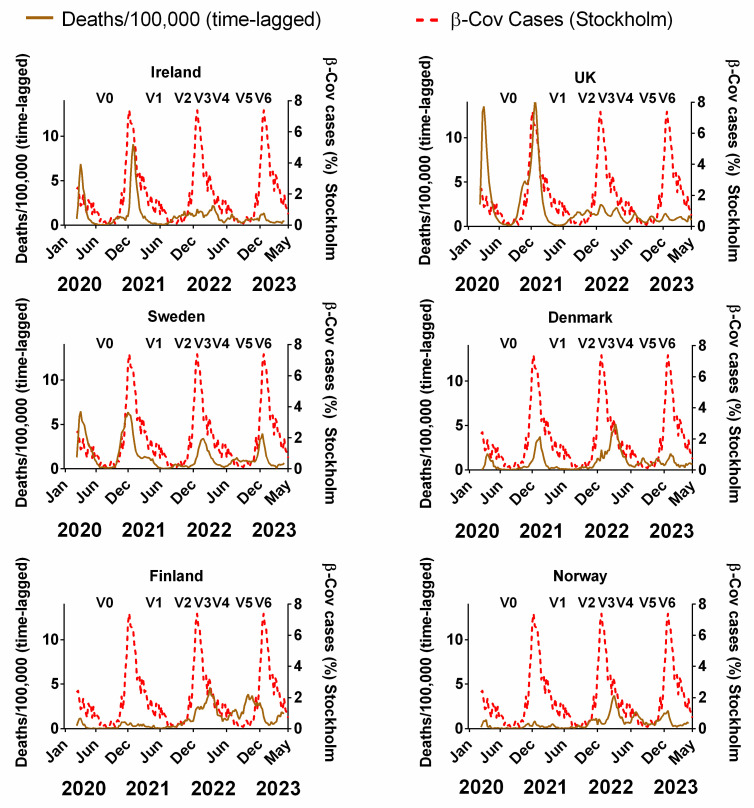
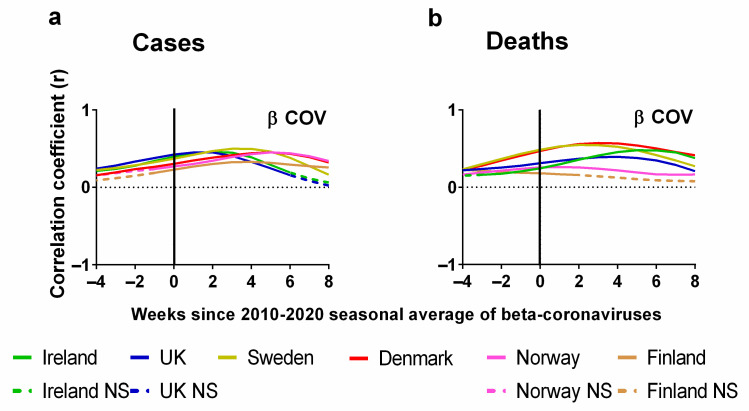
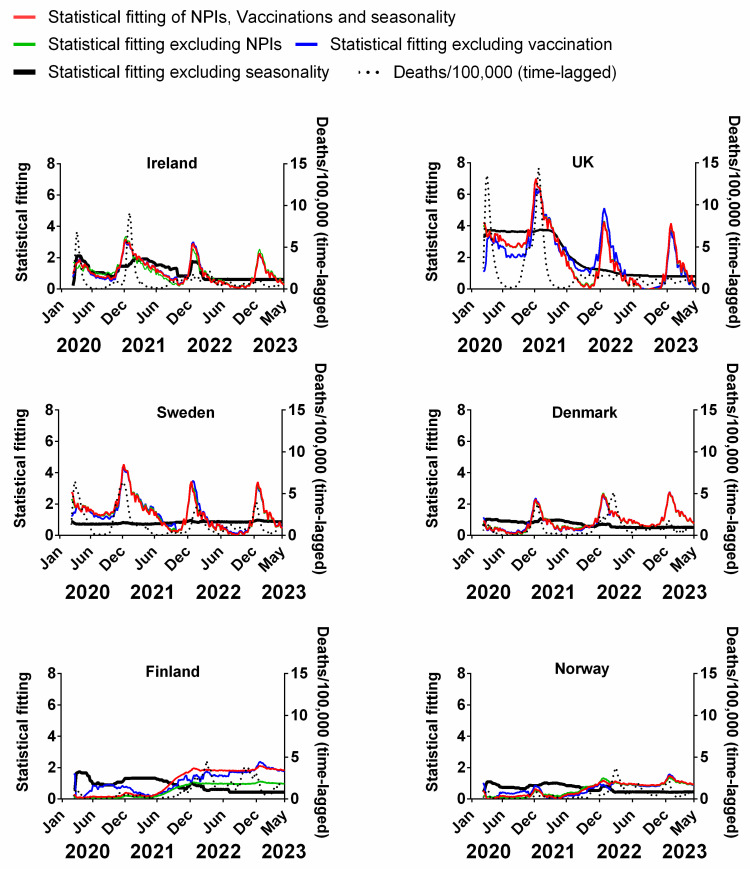
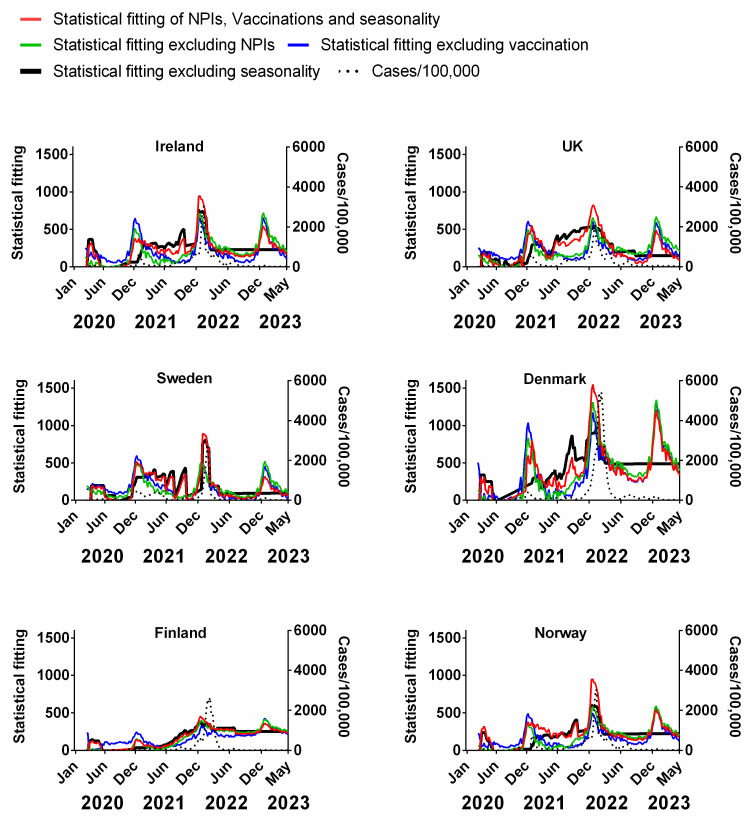
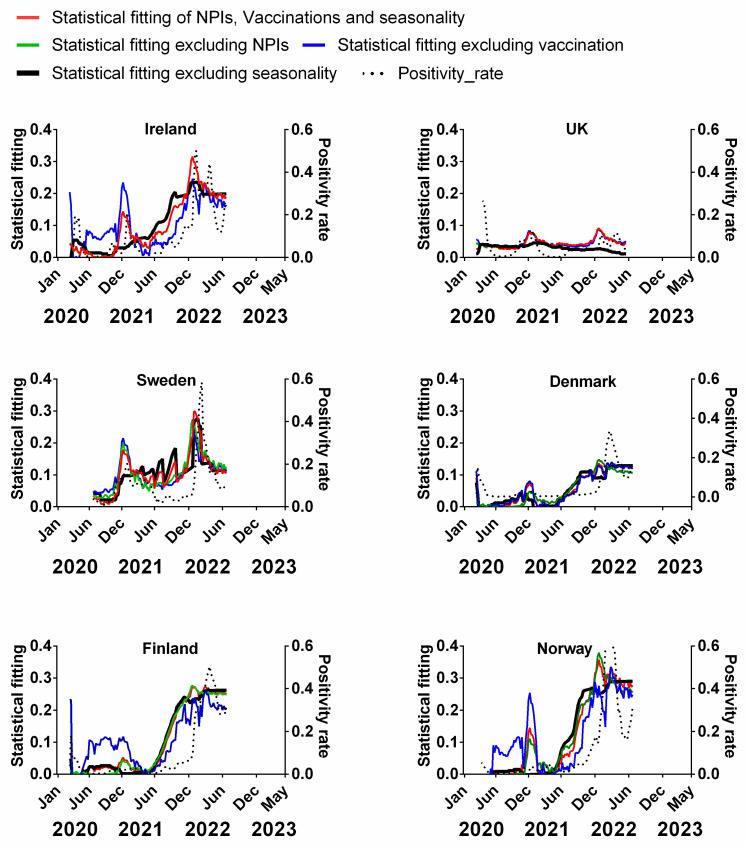
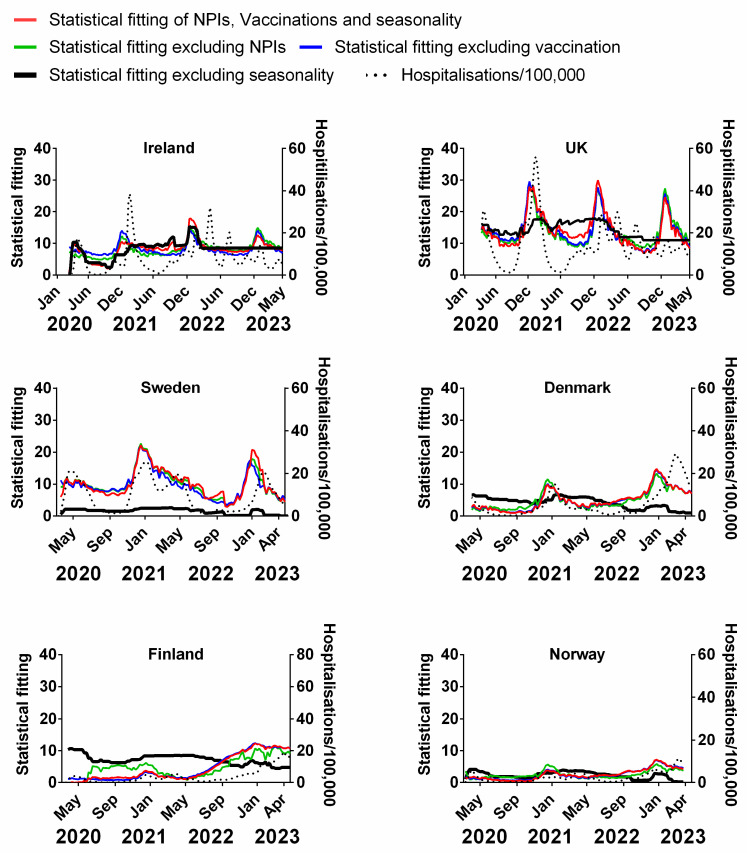
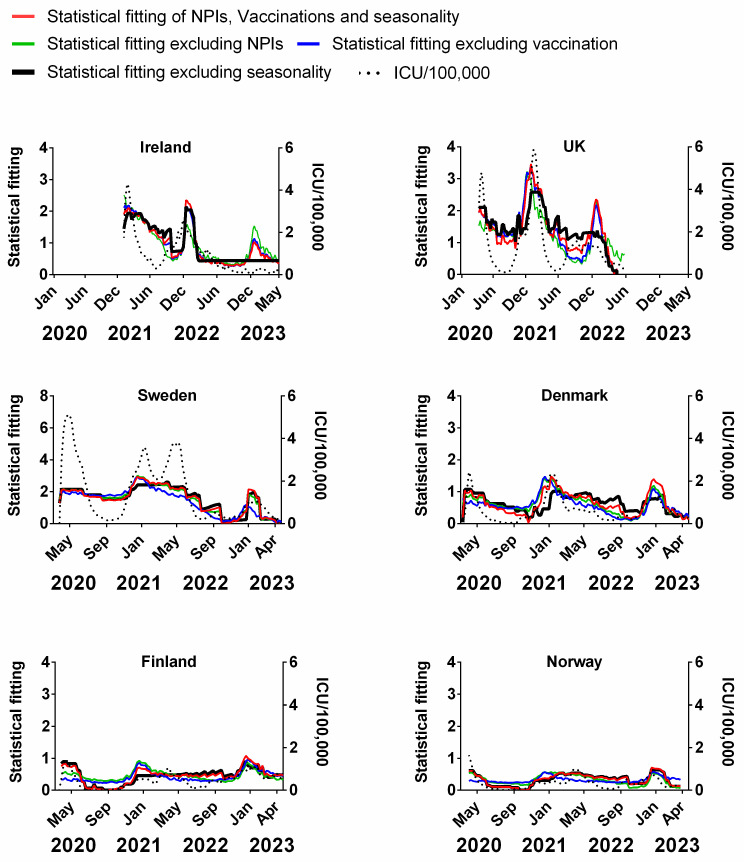
Methods: Pearson correlation coefficients and time-lagged analysis were used to examine the relationship between NPIs, vaccinations and seasonality (using the average incidence of endemic human beta-coronaviruses in Sweden over a 10-year period as a proxy) and the progression of the COVID-19 pandemic as tracked by deaths; cases; hospitalisations; intensive care unit occupancy and testing positivity rates in six Northern European countries (population 99.12 million) using a population-based, observational, ecological study method.
Findings: The waves of the pandemic correlated well with the seasonality of human beta-coronaviruses (HCoV-OC43 and HCoV-HKU1). In contrast, we could not find clear or consistent evidence that the stringency of NPIs or vaccination reduced the progression of the pandemic. However, these results are correlations and not causations.
Implications: We hypothesise that the apparent influence of NPIs and vaccines might instead be an effect of coronavirus seasonality. We suggest that policymakers consider these results when assessing policy options for future pandemics.
Limitations: The study is limited to six temperate Northern European countries with spatial and temporal variations in metrics used to track the progression of the COVID-19 pandemic. Caution should be exercised when extrapolating these findings.
Keywords: COVID-19 pandemic; Northern Europe; epidemiology; public health; seasonal variation; vaccination.
Conflict of interest statement
G.A.Q., N.E.F. and K.S. are all voluntary members of the Health and Recovery Team (HART) based in the UK. The part-funders of this study had no role in the design of the study; in the collection, analyses, or interpretation of data; in the writing of the manuscript; or in the decision to publish the results.
Figures
Similar articles
-
Birth rate decline in the later phase of the COVID-19 pandemic: the role of policy interventions, vaccination programmes, and economic uncertainty.Hum Reprod Open. 2024 Sep 10;2024(3):hoae052. doi: 10.1093/hropen/hoae052. eCollection 2024. Hum Reprod Open. 2024. PMID: 39345877 Free PMC article.
-
The Effects of Non-pharmaceutical Interventions on COVID-19 Mortality: A Generalized Synthetic Control Approach Across 169 Countries.Front Public Health. 2022 Apr 4;10:820642. doi: 10.3389/fpubh.2022.820642. eCollection 2022. Front Public Health. 2022. PMID: 35444988 Free PMC article.
-
The enigma of the 1889 Russian flu pandemic: A coronavirus?Presse Med. 2022 Sep;51(3):104111. doi: 10.1016/j.lpm.2022.104111. Epub 2022 Feb 4. Presse Med. 2022. PMID: 35124103 Free PMC article.
-
Lifting non-pharmaceutical interventions following the COVID-19 pandemic - the quiet before the storm?Expert Rev Vaccines. 2022 Nov;21(11):1541-1553. doi: 10.1080/14760584.2022.2117693. Epub 2022 Sep 5. Expert Rev Vaccines. 2022. PMID: 36039786 Review.
-
Seasonality of Common Human Coronaviruses, United States, 2014-20211.Emerg Infect Dis. 2022 Oct;28(10):1970-1976. doi: 10.3201/eid2810.220396. Epub 2022 Aug 25. Emerg Infect Dis. 2022. PMID: 36007923 Free PMC article. Review.
Cited by
-
Putting Meta-Analysis Findings in Proper Perspective: Comment on "The Effects of Nonpharmaceutical Interventions on COVID-19 Cases, Hospitalizations, and Mortality: A Systematic Literature Review and Meta-Analysis".AJPM Focus. 2024 Mar 11;3(3):100223. doi: 10.1016/j.focus.2024.100223. eCollection 2024 Jun. AJPM Focus. 2024. PMID: 38765494 Free PMC article. No abstract available.
-
Seasonality of respiratory, enteric, and urinary viruses revealed by wastewater genomic surveillance.mSphere. 2024 May 29;9(5):e0010524. doi: 10.1128/msphere.00105-24. Epub 2024 May 7. mSphere. 2024. PMID: 38712930 Free PMC article.
-
What Lessons can Be Learned From the Management of the COVID-19 Pandemic?Int J Public Health. 2025 May 30;70:1607727. doi: 10.3389/ijph.2025.1607727. eCollection 2025. Int J Public Health. 2025. PMID: 40529997 Free PMC article. Review.
-
Severity of Omicron Subvariants and Vaccine Impact in Catalonia, Spain.Vaccines (Basel). 2024 Apr 27;12(5):466. doi: 10.3390/vaccines12050466. Vaccines (Basel). 2024. PMID: 38793717 Free PMC article.
-
A Critical Analysis of All-Cause Deaths during COVID-19 Vaccination in an Italian Province.Microorganisms. 2024 Jun 30;12(7):1343. doi: 10.3390/microorganisms12071343. Microorganisms. 2024. PMID: 39065111 Free PMC article.
References
-
- Hale T., Angrist N., Goldszmidt R., Kira B., Petherick A., Phillips T., Webster S., Cameron-Blake E., Hallas L., Majumdar S., et al. A Global Panel Database of Pandemic Policies (Oxford COVID-19 Government Response Tracker) Nat. Hum. Behav. 2021;5:529–538. doi: 10.1038/s41562-021-01079-8. - DOI - PubMed
Grants and funding
LinkOut - more resources
Full Text Sources
