. 2024 Jan 11;13(2):198.
doi: 10.3390/plants13020198.

Investigation of Epilobium hirsutum L. Optimized Extract's Anti-Inflammatory and Antitumor Potential

Affiliations

Investigation of Epilobium hirsutum L. Optimized Extract's Anti-Inflammatory and Antitumor Potential

Ana-Maria Vlase et al. Plants (Basel). .

Abstract

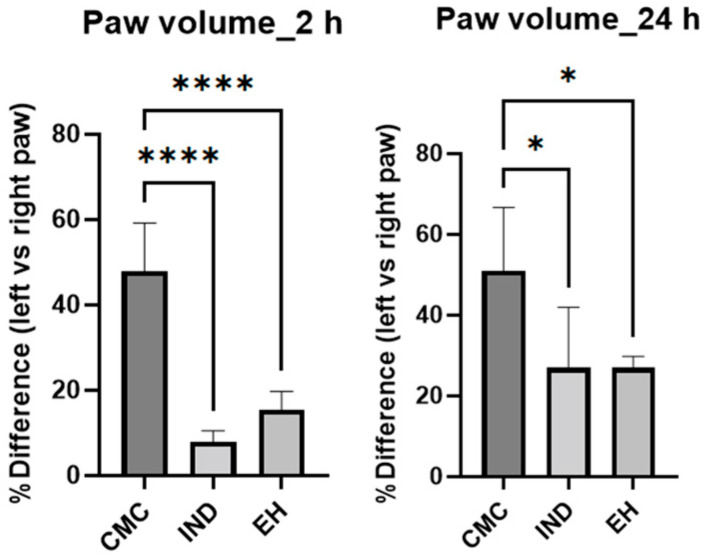
Epilobium hirsutum L., commonly known as hairy willowherb, is a perennial herbaceous plant native to Europe and Asia. In Romania, the Epilobium genus includes 17 species that are used in folk medicine for various purposes. This study aimed to investigate the anti-inflammatory and antitumor potential of the optimized extract of Epilobium hirsutum (EH) in animal models. The first study investigated the anti-inflammatory properties of EH optimized extract and the model used was carrageenan-induced paw inflammation. Wistar rats were divided into three groups: negative control, positive control treated with indomethacin, and a group treated with the extract. Oxidative stress markers, cytokine levels, and protein expressions were assessed. The extract demonstrated anti-inflammatory properties comparable to those of the control group. In the second study, the antitumor effects of the extract were assessed using the tumor model of Ehrlich ascites carcinoma. Swiss albino mice with Ehrlich ascites were divided into four groups: negative, positive treated with cyclophosphamide (Cph), Group 3 treated with Cph and EH optimized extract, and Group 4 treated with extract alone. Samples from the ascites fluid, liver, and heart were analyzed to evaluate oxidative stress, inflammation, and cancer markers. The extract showed a reduction in tumor-associated inflammation and oxidative stress. Overall, the EH optimized extract exhibited promising anti-inflammatory and antitumor effects in the animal models studied. These findings suggest its potential as a natural adjuvant therapeutic agent for addressing inflammation and oxidative stress induced by different pathologies.

Keywords: Epilobium hirsutum; Western Blot analysis; acute rat paw inflammation; anti-inflammatory activity; antioxidant potential; optimized extract.


Conflict of interest statement

The authors declare no conflicts of interest. The funders had no role in the design of the study; in the collection, analyses, or interpretation of data; in the writing of the manuscript; or in the decision to publish the results.

Figures

Figure 1
Figure 1
Quantification of cyclooxygenase-2 (COX2), nuclear factor erythroid 2–related factor 2 (NRF2), nuclear factor kappa B (NFκB), and its phosphorylated form (pNFκB) expression in the rat paw tissue at 2 h after inducing local inflammation (CMC—negative control treated with carboxymethyl cellulose; IND—positive control treated with indomethacin; EH—group treated with E. hirsutum optimized extract). Western blot was used for the respective analysis; results were normalized to glyceraldehyde 3-phosphate dehydrogenase (GAPDH) as internal standard. Statistical analysis was performed using one-way ANOVA test with Tukey’s multiple comparison post-hoc test. Values are presented as mean ± SD (* p < 0.05, ** p < 0.01, **** p < 0.0001).
Figure 2
Figure 2
Levels of oxidative stress markers: malondialdehyde (MDA), reduced glutathione (GSH), oxidized glutathione (GSSG), and their ratio (GSG/GSSG), catalase (CAT), and glutathione peroxidase (GPx) activities from the rats paw tissue homogenates (sampled at 2 and 24 h after inflammation) following a 4-day treatment with indomethacin (IND) and E. hirsutum optimized extract (EH), respectively. Carboxymethyl cellulose (CMC)—negative control. Values are presented as mean ± SD. Statistical analysis was performed using one-way ANOVA, with Tukey’s multiple comparisons post-hoc test (* p < 0.05 vs. control group, ** p < 0.01 vs. control group, *** p < 0.0001 vs. control group, **** p < 0.00001 vs. control group).
Figure 2
Figure 2
Levels of oxidative stress markers: malondialdehyde (MDA), reduced glutathione (GSH), oxidized glutathione (GSSG), and their ratio (GSG/GSSG), catalase (CAT), and glutathione peroxidase (GPx) activities from the rats paw tissue homogenates (sampled at 2 and 24 h after inflammation) following a 4-day treatment with indomethacin (IND) and E. hirsutum optimized extract (EH), respectively. Carboxymethyl cellulose (CMC)—negative control. Values are presented as mean ± SD. Statistical analysis was performed using one-way ANOVA, with Tukey’s multiple comparisons post-hoc test (* p < 0.05 vs. control group, ** p < 0.01 vs. control group, *** p < 0.0001 vs. control group, **** p < 0.00001 vs. control group).
Figure 3
Figure 3
Proinflammatory cytokines levels (IL-6—interleukin-6; TNF-alfa—tumor necrosis factor-alfa) within the rat paw tissue homogenates samples after a 4-day treatment with indomethacin (IND) and E. hirsutum optimized extract (EH), respectively. Carboxymethyl cellulose (CMC)—negative control. Values are given as mean ± SD. Statistical analysis was performed using one-way ANOVA, with Tukey’s multiple comparisons post-hoc test (* p < 0.05 vs. control group, ** p < 0.01).
Figure 4
Figure 4
The percentage difference between left rat paw volume (negative control) versus right rat paw volume (positive control) determined with a plethysmometer, at 2 and 24 h after carrageenan administration. CMC—animals treated with carboxymethyl cellulose (negative control); IND—rats treated with indomethacin (positive control); EH—animals treated with E. hirsutum optimized extract (test group) (* p < 0.05 vs. control group, **** p < 0.00001 vs. control group).
Figure 5
Figure 5
M2 (2 h)—Indomethacin (IND—positive control) vs. carboxymethyl cellulose (CMC—negative control); M3 (2 h)—E. hirsutum optimized extract vs. CMC (negative control); M4 (24 h)—IND (positive control) vs. CMC (negative control); M5 (24 h)—E. hirsutum optimized extract vs. CMC (negative control).
Figure 6
Figure 6
Levels of oxidative stress markers: malondialdehyde (MDA), reduced glutathione (GSH), oxidized glutathione (GSSG), and their ratio (GSG/GSSG), catalase (CAT), and glutathione peroxidase (GPx) activities from the mice ascites samples after a 10-day treatment with cyclophosphamide (Cph), association of Cph and E. hirsutum optimized extract (EH), and EH extract alone, respectively. Values are presented as mean ± SD. Statistical analysis was performed using one-way ANOVA, with Tukey’s multiple comparisons post-hoc test (* p < 0.05 vs. control group, ** p < 0.01 vs. control group).
Figure 7
Figure 7
Proinflammatory cytokines amount (IL-6—interleukin-6, TNF-alfa—tumor necrosis factor-alfa) within the mice ascites samples after a 10-day treatment with cyclophosphamide (Cph), association of Cph and E. hirsutum optimized extract (EH), and EH extract alone, respectively. Values are depicted as mean ± SD. Statistical analysis was performed using one-way ANOVA, with Tukey’s multiple comparisons post-hoc test (* p < 0.05 vs. control group, ** p < 0.01, **** p < 0.0001 vs. control group).
Figure 8
Figure 8
Levels of oxidative stress markers: malondialdehyde (MDA), reduced glutathione (GSH), oxidized glutathione (GSSG), and their ratio (GSG/GSSG), catalase (CAT), and glutathione peroxidase (GPx) activities from the mice liver samples after a 10-day treatment with cyclophosphamide (Cph), association of Cph and E. hirsutum optimized extract (EH), and EH extract alone, respectively. Values are presented as mean ± SD. Statistical analysis was performed using one-way ANOVA, with Tukey’s multiple comparisons post-hoc test (* p < 0.05, ** p < 0.01, *** p < 0.001, **** p < 0.0001).
Figure 9
Figure 9
Proinflammatory cytokines levels (IL-6—interleukin-6, TNF-alfa—tumor necrosis factor-alfa) within the mice liver samples after a 10-day treatment with cyclophosphamide (Cph), association of Cph and E. hirsutum optimized extract (EH), and EH extract alone, respectively. Values are depicted as mean ± SD. Statistical analysis was performed using one-way ANOVA, with Tukey’s multiple comparisons post-hoc test.
Figure 10
Figure 10
Levels of oxidative stress markers: malondialdehyde (MDA), reduced glutathione (GSH), oxidized glutathione (GSSG), and their ratio (GSG/GSSG), catalase (CAT), and glutathione peroxidase (GPx) activities from the mice heart samples after a 10-day treatment with cyclophosphamide (Cph), association of Cph and E. hirsutum optimized extract (EH), and EH extract alone, respectively. Values are presented as mean ± SD. Statistical analysis was performed using one-way ANOVA, with Tukey’s multiple comparisons post-hoc test (* p < 0.05, ** p < 0.01, *** p < 0.001, **** p < 0.0001).
Figure 11
Figure 11
Proinflammatory cytokines amount (IL-6—interleukin-6; TNF-alfa—tumor necrosis factor-alfa) within the mice heart samples after a 10-day treatment with cyclophosphamide (Cph), association of Cph and E. hirsutum optimized extract (EH), and EH extract alone, respectively. Values are presented as mean ± SD. Statistical analysis was performed using one-way ANOVA, with Tukey’s multiple comparisons post-hoc test (* p < 0.05 vs. control group).
Figure 12
Figure 12
M7 (ascites fluid), M10 (heart), M13 (liver)—ascites + cyclophosphamide (positive control) vs. ascites (negative control); M9 (ascites fluid), M12 (heart), and M15 (liver)—E. hirsutum optimized extract vs. ascites (negative control); M8 (ascites fluid), M11 (heart), and M14 (liver)—cyclophosphamide + E. hirsutum optimized extract vs. ascites (negative control).
Figure 13
Figure 13
Caspase-3, caspase-9, tumor suppressor protein p53, B-cell lymphoma 2 (BCL-2), and BCL-2-like protein 4 (BAX) levels in mice ascites samples after 10-day treatment with cyclophosphamide (Cph), association of Cph and E. hirsutum optimized extract (EH), and EH extract alone, respectively. Western blot was used for the respective analysis; results were normalized to glyceraldehyde 3-phosphate dehydrogenase (GAPDH) as internal standard. Statistical analysis was performed using one-way ANOVA, with Tukey’s multiple comparisons post-hoc test. Values are given as means ± SD (** p < 0.01 vs. control group).
Figure 14
Figure 14
Histological appearance of the liver in the control group ((a)—ascites) and experimental groups ((b)—ascites + cyclophosphamide; (c)—cyclophosphamide + E. hirsutum optimized extract; (d)—E. hirsutum optimized extract). Hematoxylin–eosin staining, ×200.
Figure 15
Figure 15
Histological appearance of the liver after reticulin staining in the control group ((a)—ascites) and experimental groups ((b)—ascites + cyclophosphamide; (c)—cyclophosphamide + E. hirsutum optimized extract; (d)—E. hirsutum optimized extract). ×200.
Figure 16
Figure 16
Histological appearance of the liver in the control group ((a)—ascites) and experimental groups ((b)—ascites + cyclophosphamide; (c)—cyclophosphamide + E. hirsutum optimized extract; (d)—E. hirsutum optimized extract) stained with Van Gieson method, ×200.
Figure 17
Figure 17
Histological appearance of the liver in the control group ((a)—ascites) and experimental groups ((b)—ascites + cyclophosphamide; (c)—cyclophosphamide + E. hirsutum optimized extract; (d)—E. hirsutum optimized extract) with Mallory’s trichrome staining.
Figure 18
Figure 18
SUS plot interpretation. Shared effects: Diagonal A—in the same direction; Diagonal B—in opposite direction. Unique effects: Region 1—unique decrease—and Region 2—unique increase induced by “treatment”; Region 3—unique increase—and Region 4—unique decrease induced by (+) control.

References

    1. Bernstein N., Akram M., Daniyal M., Koltai H., Fridlender M., Gorelick J. Advances in Agronomy. Volume 150. Elsevier; Amsterdam, The Netherlands: 2018. Antiinflammatory Potential of Medicinal Plants: A Source for Therapeutic Secondary Metabolites; pp. 131–183.
    1. Nyakudya T.T., Tshabalala T., Dangarembizi R., Erlwanger K.H., Ndhlala A.R. The Potential Therapeutic Value of Medicinal Plants in the Management of Metabolic Disorders. Molecules. 2020;25:2669. doi: 10.3390/molecules25112669. - DOI - PMC - PubMed
    1. Josiah A.J., Twilley D., Pillai S.K., Ray S.S., Lall N. Pathogenesis of Keratinocyte Carcinomas and the Therapeutic Potential of Medicinal Plants and Phytochemicals. Molecules. 2021;26:1979. doi: 10.3390/molecules26071979. - DOI - PMC - PubMed
    1. Izuegbuna O. Leukemia Chemoprevention and Therapeutic Potentials: Selected Medicinal Plants with Anti-Leukemic Activities. Nutr. Cancer. 2022;74:437–449. doi: 10.1080/01635581.2021.1924209. - DOI - PubMed
    1. Kim H.P., Lim H., Kwon Y.S. Therapeutic Potential of Medicinal Plants and Their Constituents on Lung Inflammatory Disorders. Biomol. Ther. 2017;25:91–104. doi: 10.4062/biomolther.2016.187. - DOI - PMC - PubMed