

Species Survey of Leaf Hyponasty Responses to Warming Plus Elevated CO2
- PMID: 38256757
- PMCID: PMC10819384
- DOI: 10.3390/plants13020204
Species Survey of Leaf Hyponasty Responses to Warming Plus Elevated CO2
Abstract
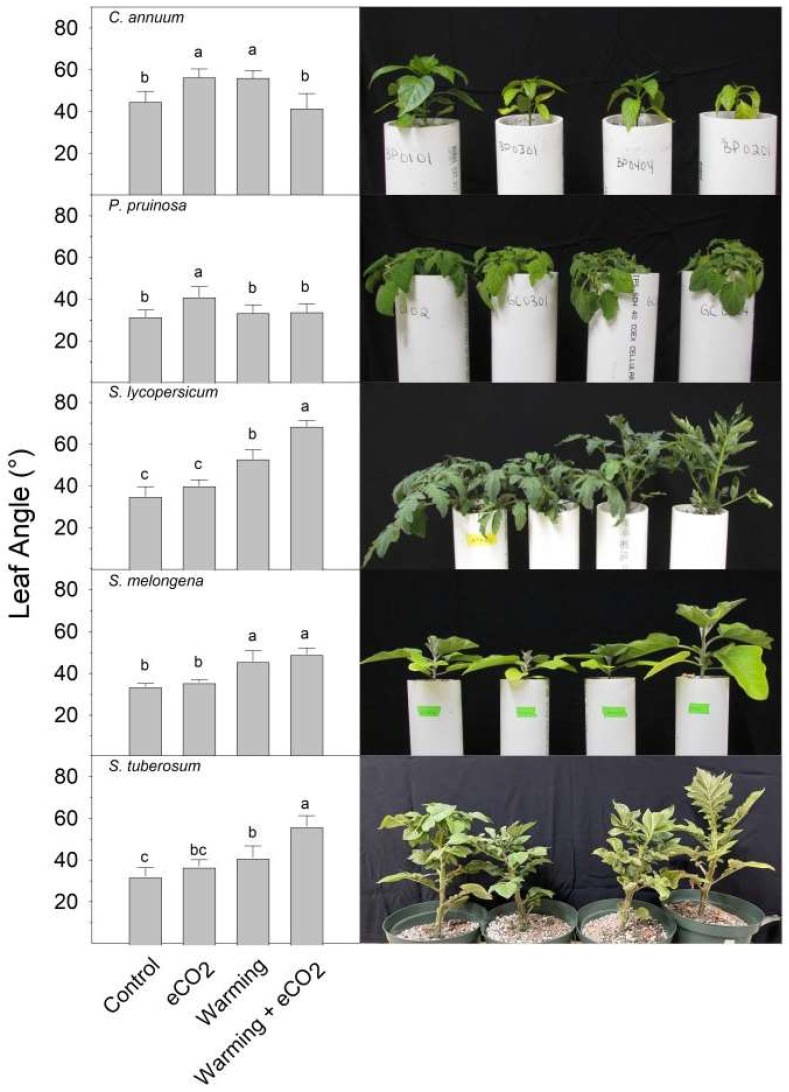
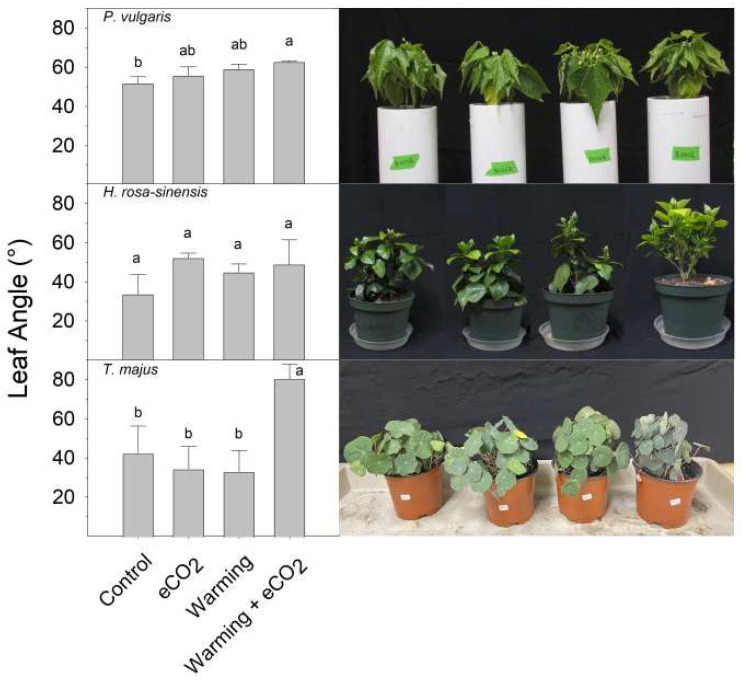
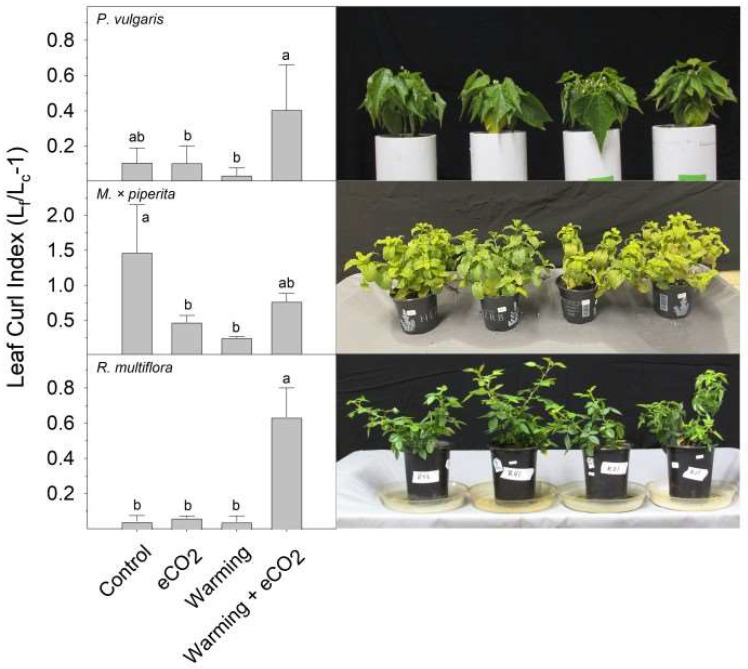
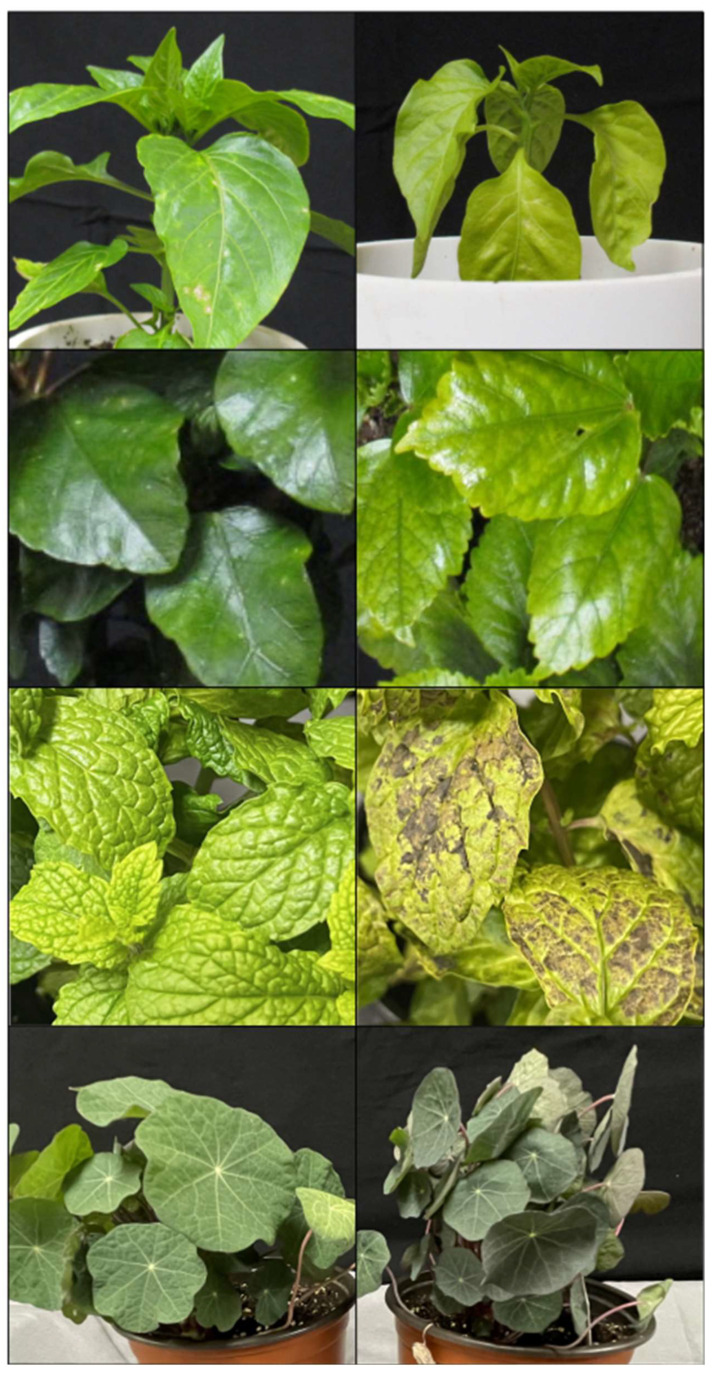
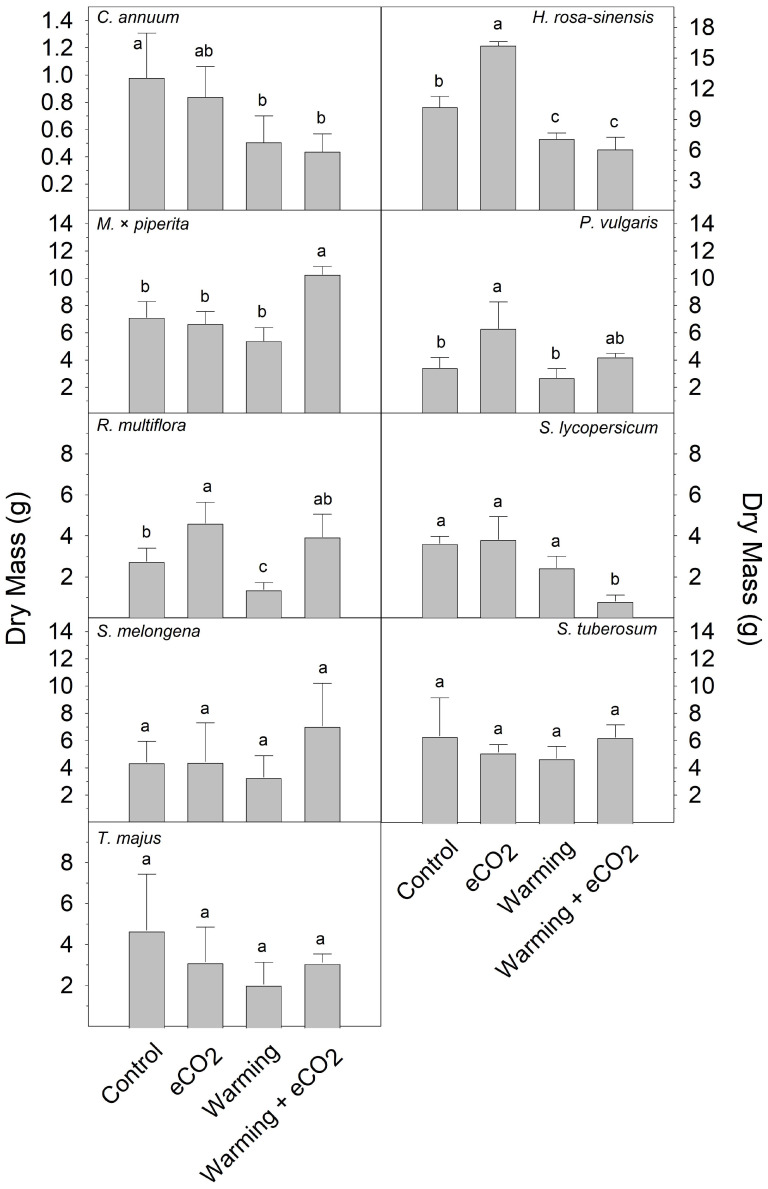
Atmospheric carbon dioxide (CO2) concentrations are increasing and may exceed 800 ppm by 2100. This is increasing global mean temperatures and the frequency and severity of heatwaves. Recently, we showed for the first time that the combination of short-term warming and elevated carbon dioxide (eCO2) caused extreme upward bending (i.e., hyponasty) of leaflets and leaf stems (petioles) in tomato (Solanum lycopersicum), which reduced growth. Here, we examined additional species to test the hypotheses that warming + eCO2-induced hyponasty is restricted to compound-leaved species, and/or limited to the Solanaceae. A 2 × 2 factorial experiment with two temperatures, near-optimal and supra-optimal, and two CO2 concentrations, ambient and elevated (400, 800 ppm), was imposed on similarly aged plants for 7-10 days, after which final petiole angles were measured. Within Solanaceae, compound-leaf, but not simple-leaf, species displayed increased hyponasty with the combination of warming + eCO2 relative to warming or eCO2 alone. In non-solanaceous species, hyponasty, leaf-cupping, and changes in leaf pigmentation as a result of warming + eCO2 were variable across species.
Keywords: climate change; hyponasty; leaf angle; morphology.
Conflict of interest statement
The authors declare no conflict of interest.
Figures
Similar articles
-
Elevated carbon dioxide plus chronic warming causes dramatic increases in leaf angle in tomato, which correlates with reduced plant growth.Plant Cell Environ. 2019 Apr;42(4):1247-1256. doi: 10.1111/pce.13489. Epub 2019 Jan 18. Plant Cell Environ. 2019. PMID: 30472733
-
Elevated Carbon Dioxide and Chronic Warming Together Decrease Nitrogen Uptake Rate, Net Translocation, and Assimilation in Tomato.Plants (Basel). 2021 Apr 8;10(4):722. doi: 10.3390/plants10040722. Plants (Basel). 2021. PMID: 33917687 Free PMC article.
-
A meta-analysis of the combined effects of elevated carbon dioxide and chronic warming on plant %N, protein content and N-uptake rate.AoB Plants. 2021 May 25;13(4):plab031. doi: 10.1093/aobpla/plab031. eCollection 2021 Aug. AoB Plants. 2021. PMID: 34285792 Free PMC article. Review.
-
Leaf coordination between petiole vascular development and water demand in response to elevated CO2 in tomato plants.Plant Direct. 2022 Jan 9;6(1):e371. doi: 10.1002/pld3.371. eCollection 2022 Jan. Plant Direct. 2022. PMID: 35028493 Free PMC article.
-
Temporal variability in tree responses to elevated atmospheric CO2.Plant Cell Environ. 2021 May;44(5):1292-1310. doi: 10.1111/pce.13986. Epub 2021 Jan 9. Plant Cell Environ. 2021. PMID: 33368341 Review.
References
-
- Intergovernmental Panel on Climate Change . In: Summary for Policymakers: Climate Change 2021: The Physical Science Basis. Masson-Delmotte V., Zhai P.M., Pirani S.L., Connors C., Péan S., Berger N., Caud Y., Chen L., Goldfarb M.I., Gomis M.I., et al., editors. IPCC; Geneva, Switzerland: 2021. pp. 1–31. Contribution of Working Group I to the Sixth Assessment Report of the Intergovernmental Panel on Climate Change.
-
- Schleussner C., Deryng D., Müller C., Elliott J., Saeed F., Folberth C., Liu W., Wang X., Pugh T., Thiery W., et al. Crop productivity changes in 1.5 °C and 2 °C worlds under climate sensitivity uncertainty. Environ. Res. Lett. 2019;13:064007. doi: 10.1088/1748-9326/aab63b. - DOI
Grants and funding
LinkOut - more resources
Full Text Sources
