. 2024 Jan 9;16(2):196.
doi: 10.3390/polym16020196.

Affinity-Based Magnetic Nanoparticle Development for Cancer Stem Cell Isolation

Affiliations

Affinity-Based Magnetic Nanoparticle Development for Cancer Stem Cell Isolation

Cansu İlke Kuru et al. Polymers (Basel). .

Abstract

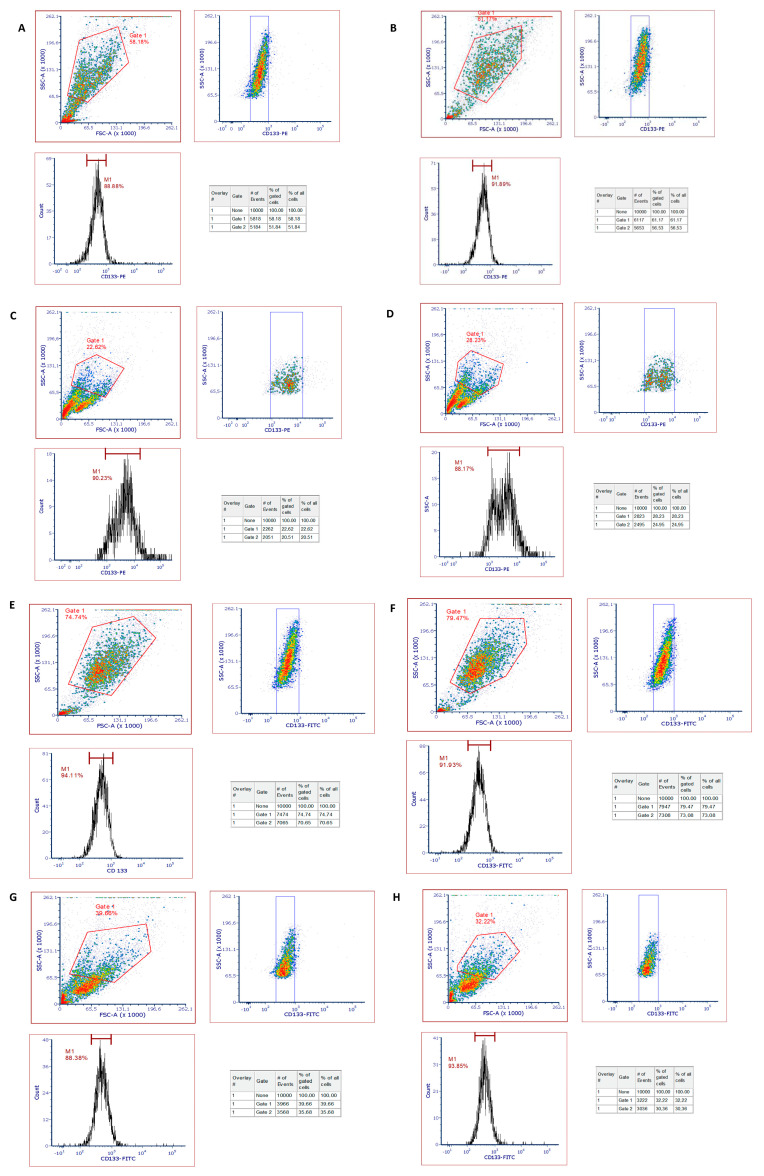
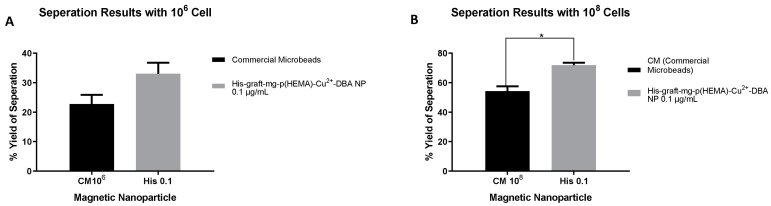
Cancer is still the leading cause of death in the world despite the developing research and treatment opportunities. Failure of these treatments is generally associated with cancer stem cells (CSCs), which cause metastasis and are defined by their resistance to radio- and chemotherapy. Although known stem cell isolation methods are not sufficient for CSC isolation, they also bring a burden in terms of cost. The aim of this study is to develop a high-efficiency, low-cost, specific method for cancer stem cell isolation with magnetic functional nanoparticles. This study, unlike the stem cell isolation techniques (MACS, FACS) used today, was aimed to isolate cancer stem cells (separation of CD133+ cells) with nanoparticles with specific affinity and modification properties. For this purpose, affinity-based magnetic nanoparticles were synthesized and characterized by providing surface activity and chemical reactivity, as well as making surface modifications necessary for both lectin affinity and metal affinity interactions. In the other part of the study, synthesized and characterized functional polymeric magnetic nanoparticles were used for the isolation of CSC from the human osteosarcoma cancer cell line (SAOS-2) with a cancer stem cell subpopulation bearing the CD133 surface marker. The success and efficiency of separation after stem cell isolation were evaluated via the MACS and FACS methods. As a result, when the His-graft-mg-p(HEMA) nanoparticle was used at a concentration of 0.1 µg/mL for 106 and 108 cells, superior separation efficiency to commercial microbeads was obtained.

Keywords: affinity interactions; cancer stem cell; magnetic nanoparticle; stem cell isolation.


Conflict of interest statement

The authors declare no conflict of interest.

Figures

Figure 1
Figure 1
DBA binding capacities of mg-p(HEMA), His-graft-mg-p(HEMA), and His-graft-mg-p(HEMA)-Cu2+ magnetic particles (0.25 mg/mL DBA, pH 7.4, 0.1 M phosphate buffer, room temperature). Error bars show the %SE.
Figure 2
Figure 2
FTIR spectra of mg-p(HEMA) and His-graft-mg-p(HEMA) nanoparticles.
Figure 3
Figure 3
SEM images of mg-p(HEMA) np (25 kx, 50 kx, 80 kx, 100 kx).
Figure 4
Figure 4
SEM images of His-graft-mg-p(HEMA) np (25 kx, 50 kx, 80 kx, 100 kx).
Figure 5
Figure 5
AFM image of mg-p(HEMA) and His-graft-mg-p(HEMA) np.
Figure 6
Figure 6
ESR spectrum for mg-p(HEMA).
Figure 7
Figure 7
Zeta size analysis of mg-p(HEMA) and His-graft-mg-p(HEMA) magnetic nanoparticles.
Figure 7
Figure 7
Zeta size analysis of mg-p(HEMA) and His-graft-mg-p(HEMA) magnetic nanoparticles.
Figure 8
Figure 8
Zeta potential analysis of His-graft-mg-p(HEMA)-Cu2+-DBA magnetic nanoparticles.
Figure 9
Figure 9
(A) A cell viability graph was obtained to examine the cytotoxic effect of mg-p(HEMA) nanoparticles on the HEK293 cell line. (B) A cell viability graph was obtained to examine the cytotoxic effect of His-graft-mg-p(HEMA) nanoparticles on the HEK293 cell line. (C) A cell viability graph was obtained to examine the cytotoxic effect of His-graft-mg-p(HEMA)-Cu2+ nanoparticles on the HEK293 cell line. (D) A cell viability graph was obtained to examine the cytotoxic effect of His-graft-mg-p(HEMA)-Cu2+-DBA nanoparticles on the HEK293 cell line. (E) A cell viability graph was obtained to examine the cytotoxic effect of mg-p(HEMA) nanoparticles on the SAOS-2 cell line. (F) A cell viability graph was obtained to examine the cytotoxic effect of His-graft-mg-p(HEMA) nanoparticles on the SAOS-2 cell line. (G) A cell viability graph was obtained to examine the cytotoxic effect of His-graft-mg-p(HEMA)-Cu2+ nanoparticles on the SAOS-2 cell line. (H) A cell viability graph was obtained to examine the cytotoxic effect of His-graft-mg-p(HEMA)-Cu2+-DBA nanoparticles on the SAOS-2 cell line. In subfigure (B), at the end of 24 h, toxic effects were observed at 10 and 100 µg/mL concentrations, while other concentrations did not cause a significant difference in viability compared to cell control. (** p ≤ 0.001, *** p ≤ 0.0001). In subfigure (C), after 24 h, all nanoparticle concentrations caused a significant decrease in viability compared to cell control. (*** p ≤ 0.0001). In subfigure (D), toxic effects were observed at all concentrations after 24 h. (* p ≤ 0.01, *** p ≤ 0.0001). In subfigure (E), at the end of 24 h, toxic effects were observed at high concentrations (10–600 µg/mL), while other concentrations did not cause a significant difference in viability compared to cell control. (** p ≤ 0.001, *** p ≤ 0.0001). In subfigure (F), at the end of 24 h, there was a significant decrease in viability compared to cell control at all nanoparticle concentrations. (* p ≤ 0.01, *** p ≤ 0.0001). In subfigure (G), after 24 h, there was a significant decrease in viability relative to cell control at all concentrations. (** p ≤ 0.001; *** p ≤ 0.0001). In subfigure (H), after 24 h, there was a significant decrease in viability relative to cell control at all concentrations except the low concentrations of 0.1 and 1 µg/mL (** p ≤ 0.001, *** p ≤ 0.0001).
Figure 10
Figure 10
(A,B) Flow cytometry analysis of separation using commercial microbeads from 108 cell counts—repetition 1 and 2. (C,D) Flow cytometry analysis of separation using commercial microbeads from 106 cell counts—repetition 1 and 2. (E,F) Flow cytometry analysis of the separation was performed by using His-graft-mg-p(HEMA)-Cu2+-DBA nanoparticles at a concentration of 0.1 µg/mL from 108 cell counts—repetition 1 and 2. (G,H) Flow cytometry analysis of the separation was performed by using His-graft-mg-p(HEMA)-Cu2+-DBA nanoparticles at a concentration of 0.1 µg/mL from 106 cell counts—repetition 1 and 2.
Figure 11
Figure 11
(A) % yield results of CD133+ cells separated from 106 cells with commercial microbeads, 0.1 µg/mL His-graft-mg-p(HEMA)-Cu2+-DBA nanoparticles. (B) % yield results of CD133+ cells separated from 108 cells with commercial microbeads, 0.1 µg/mL concentration of mg-p(HEMA)-HIS-Cu2+-DBA nanoparticles. (* p ≤ 0.05).

Similar articles

References

    1. Liu S.P., Fu R.H., Huang S.J., Huang Y.C., Chen S.Y., Chang C.H., Liu C.H., Tsai C.H., Shyu W.C., Lin S.Z. Stem cell applications in regenerative medicine for neurological disorders. Cell Transplant. 2013;22:631–637. doi: 10.3727/096368912X655145. - DOI - PubMed
    1. Zakrzewski W., Dobrzyński M., Szymonowicz M., Rybak Z. Stem cells: Past, present, and future. Stem Cell Res. Ther. 2019;10:68. doi: 10.1186/s13287-019-1165-5. - DOI - PMC - PubMed
    1. Uchida N., Buck D.W., He D., Reitsma M.J., Masek M., Phan T.V., Tsukamoto A.S., Gage F.H., Weissman I.L. Direct isolation of human central nervous system stem cells. Proc. Natl. Acad. Sci. USA. 2000;97:14720–14725. doi: 10.1073/pnas.97.26.14720. - DOI - PMC - PubMed
    1. Wang X. Stem cells in tissues, organoids, and cancers. Cell. Mol. Life Sci. 2019;76:4043–4070. doi: 10.1007/s00018-019-03199-x. - DOI - PMC - PubMed
    1. Politis M., Lindvall O. Clinical application of stem cell therapy in Parkinson’s disease. BMC Med. 2012;10:1. doi: 10.1186/1741-7015-10-1. - DOI - PMC - PubMed