Randomized Controlled Trial
. 2024 Jan 10;16(2):217.
doi: 10.3390/nu16020217.

Effects of a Comprehensive Dietary Intervention Program, Promoting Nutrition Literacy, Eating Behavior, Dietary Quality, and Gestational Weight Gain in Chinese Urban Women with Normal Body Mass Index during Pregnancy

Affiliations
Randomized Controlled Trial

Effects of a Comprehensive Dietary Intervention Program, Promoting Nutrition Literacy, Eating Behavior, Dietary Quality, and Gestational Weight Gain in Chinese Urban Women with Normal Body Mass Index during Pregnancy

Qian Li et al. Nutrients. .

Abstract

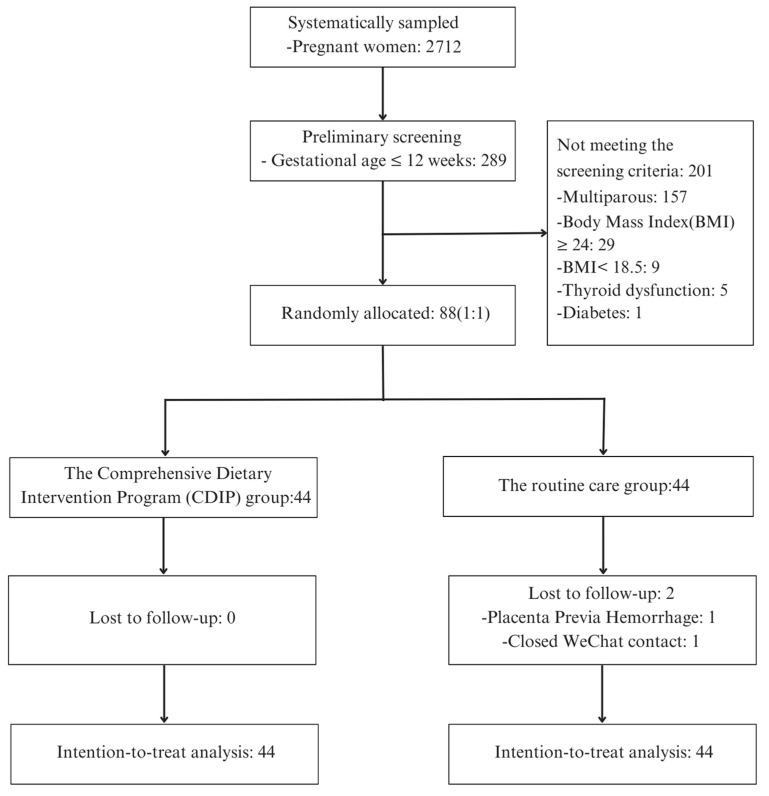
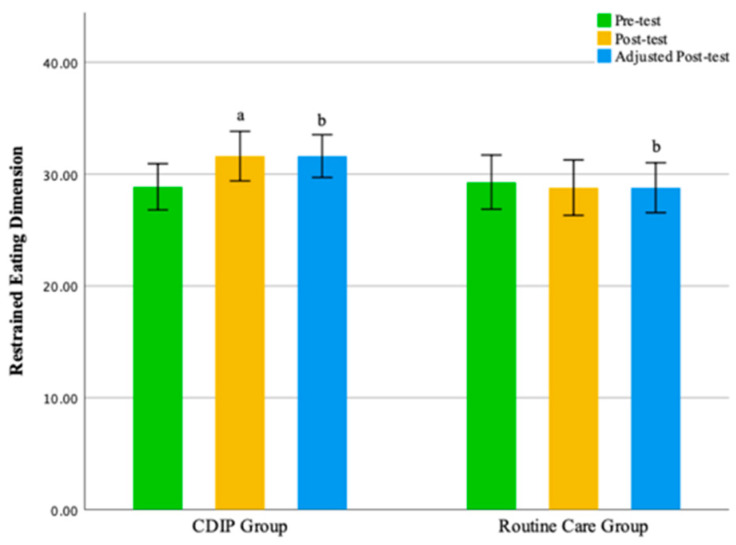
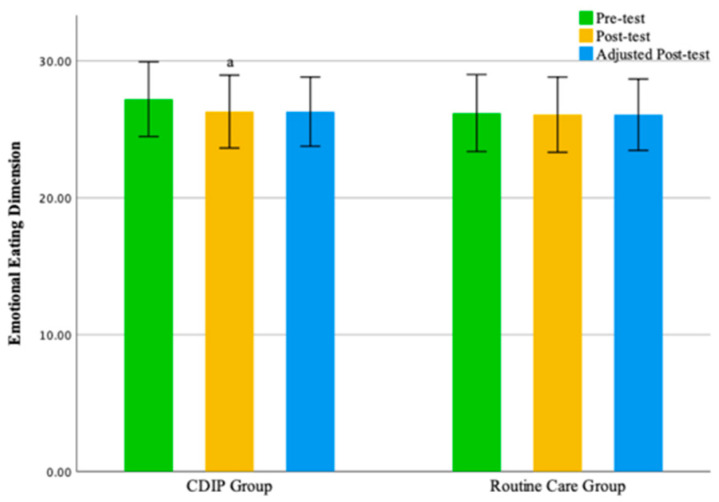
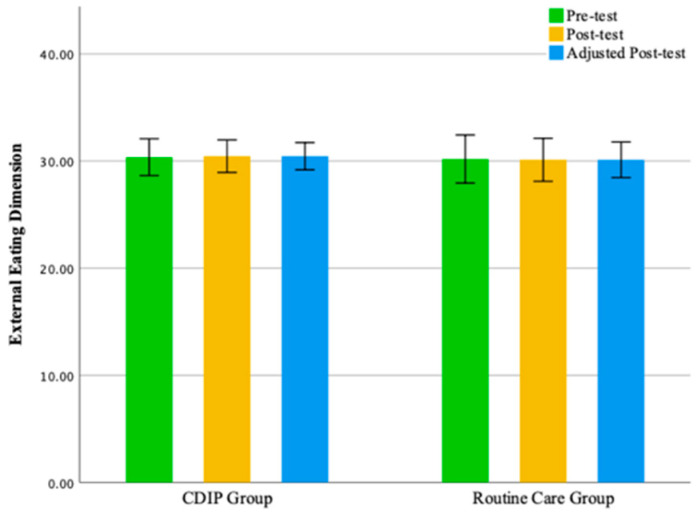
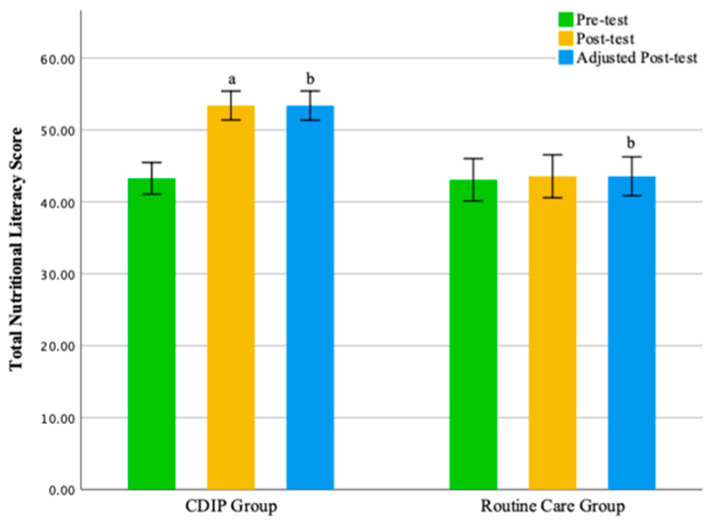
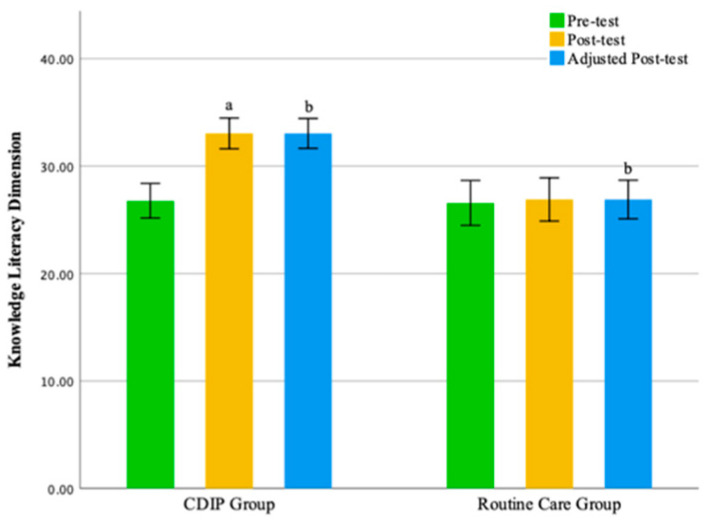
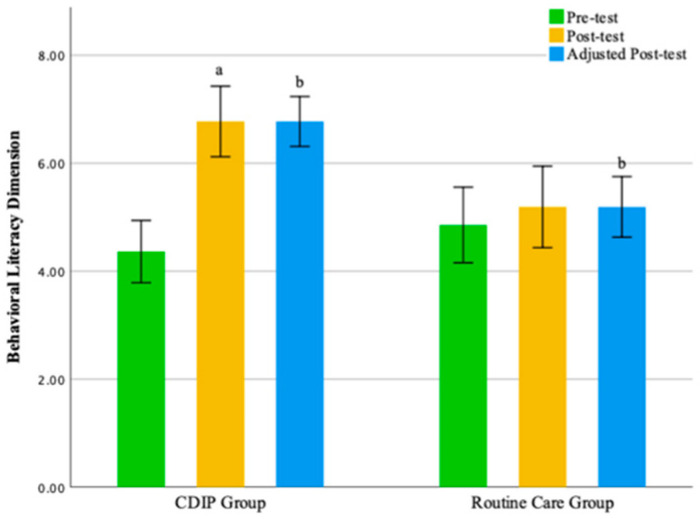
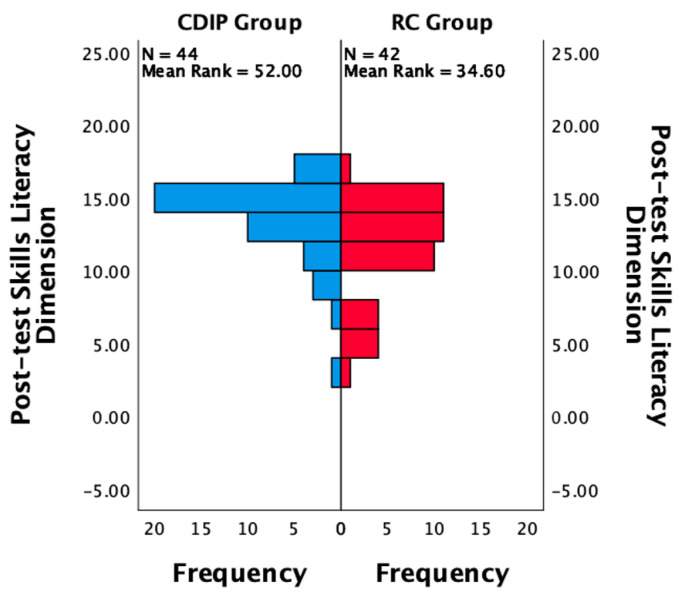
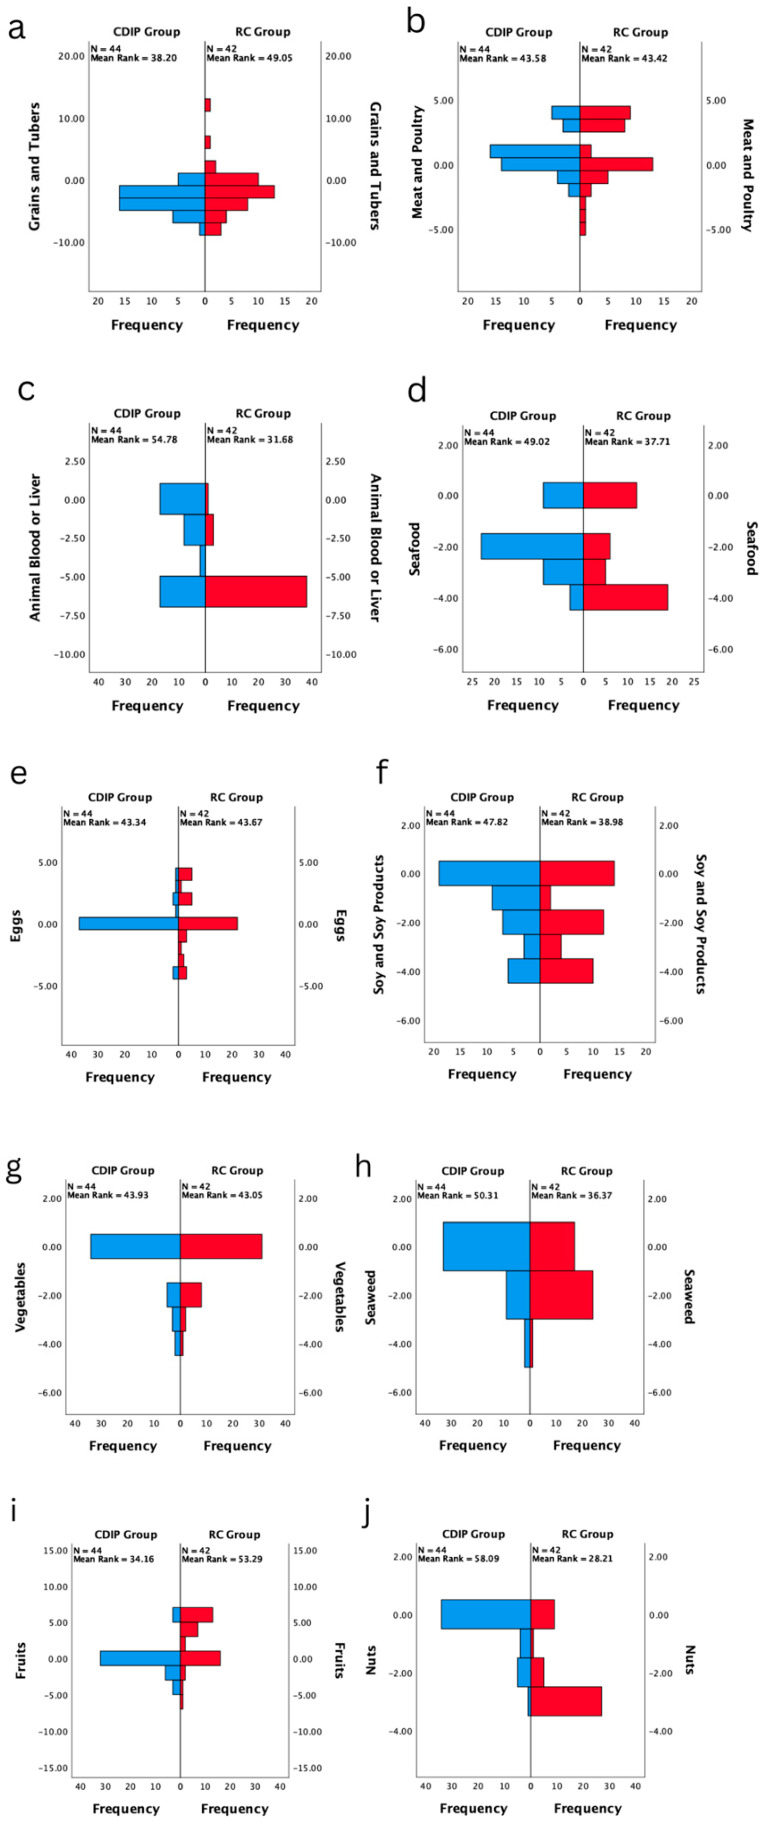
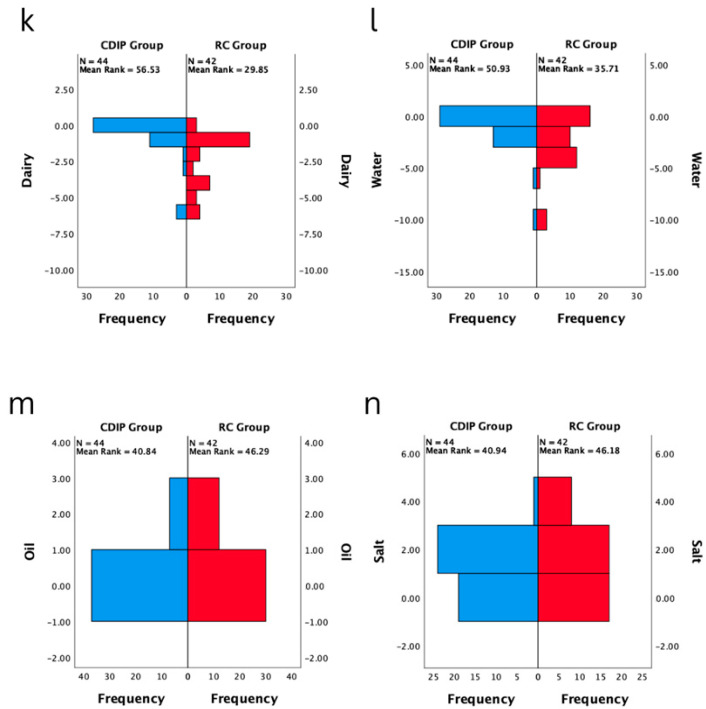
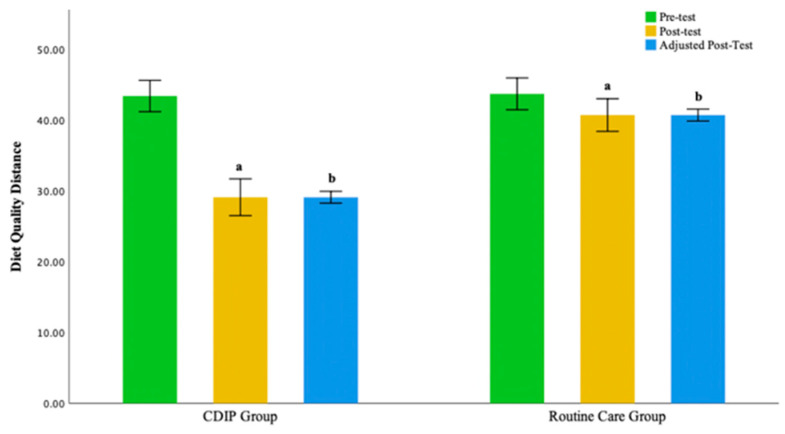
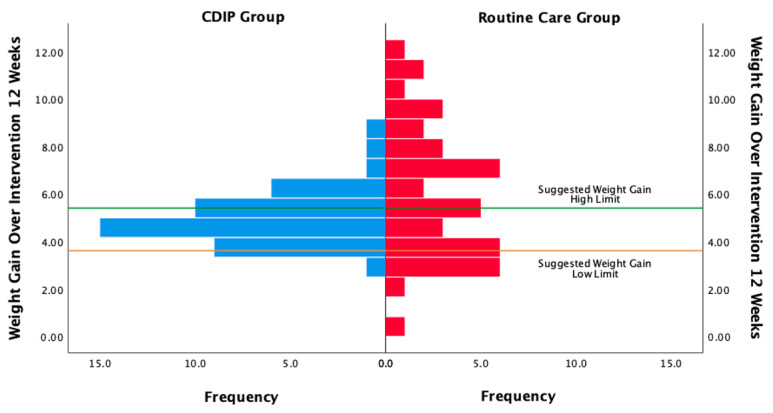
In urban Chinese women with normal body weight during pregnancy, we implemented a comprehensive dietary intervention program aimed at enhancing nutrition literacy, dietary quality, and gestational weight gain. The methods included both online and offline health education on prenatal nutrition, weekly weight monitoring, family back education practices, and real-time dietary guidance. The intervention was delivered to randomly assigned control and intervention group participants from gestational week 12 to week 24. The intervention group (n = 44; 100% complete data) showed significant differences (mean (SD)) compared to the control group (n = 42; 95.5% complete data) in nutrition literacy (53.39 ± 6.60 vs. 43.55 ± 9.58, p < 0.001), restrained eating (31.61 ± 7.28 vs. 28.79 ± 7.96, p < 0.001), Diet Quality Distance (29.11 ± 8.52 vs. 40.71 ± 7.39, p < 0.001), and weight gain within the first 12 weeks of intervention (4.97 ± 1.33 vs. 5.98 ± 2.78, p = 0.029). However, there was no significant difference in the incidence of gestational diabetes (2 (4.5%) vs. 4 (9.5%), p = 0.629). Participants in the intervention group reported an overall satisfaction score of 4.70 ± 0.46 for the intervention strategy. These results emphasize the positive role of comprehensive dietary intervention in promoting a healthy diet during pregnancy.

Keywords: digital; eating behavior; health literacy; intervention; nutrition; pregnancy; weight.


Conflict of interest statement

The authors declare no conflicts of interest. The funders had no role in the design of the study; in the collection, analyses, or interpretation of data; in the writing of the manuscript; or in the decision to publish the results.

Figures

Figure 1
Figure 1
Recruitment and intervention flowchart.
Figure 2
Figure 2
Baseline comparison of balance coefficients for various nutrients in two groups (n = 88). Note: (a) represents the comparison of frequency distributions in the dietary balance index of grains and tubers between two post-test groups; (b) signifies the comparison of frequency distributions in the dietary balance index of meat and poultry between two post-test groups; (c) denotes the comparison of frequency distributions in the dietary balance index of animal blood or liver between two post-test groups; (d) indicates the comparison of frequency distributions in the dietary balance index of seafood between two post-test groups; (e) stands for the comparison of frequency distributions in the dietary balance index of eggs between two post-test groups; (f) illustrates the comparison of frequency distributions in the dietary balance index of soy and soy products between two post-test groups; (g) showcases the comparison of frequency distributions in the dietary balance index of vegetables between two post-test groups; (h) highlights the comparison of frequency distributions in the dietary balance index of seaweed between two post-test groups; (i) focuses on the comparison of frequency distributions in the dietary balance index of fruits between two post-test groups; (j) portrays the comparison of frequency distributions in the dietary balance index of nuts between two post-test groups; (k) outlines the comparison of frequency distributions in the dietary balance index of dairy between two post-test groups; (l) emphasizes the comparison of frequency distributions in the dietary balance index of water between two post-test groups; (m) represents the comparison of frequency distributions in the dietary balance index of oil between two post-test groups; (n) signifies the comparison of frequency distributions in the dietary balance index of salt between two post-test groups.
Figure 2
Figure 2
Baseline comparison of balance coefficients for various nutrients in two groups (n = 88). Note: (a) represents the comparison of frequency distributions in the dietary balance index of grains and tubers between two post-test groups; (b) signifies the comparison of frequency distributions in the dietary balance index of meat and poultry between two post-test groups; (c) denotes the comparison of frequency distributions in the dietary balance index of animal blood or liver between two post-test groups; (d) indicates the comparison of frequency distributions in the dietary balance index of seafood between two post-test groups; (e) stands for the comparison of frequency distributions in the dietary balance index of eggs between two post-test groups; (f) illustrates the comparison of frequency distributions in the dietary balance index of soy and soy products between two post-test groups; (g) showcases the comparison of frequency distributions in the dietary balance index of vegetables between two post-test groups; (h) highlights the comparison of frequency distributions in the dietary balance index of seaweed between two post-test groups; (i) focuses on the comparison of frequency distributions in the dietary balance index of fruits between two post-test groups; (j) portrays the comparison of frequency distributions in the dietary balance index of nuts between two post-test groups; (k) outlines the comparison of frequency distributions in the dietary balance index of dairy between two post-test groups; (l) emphasizes the comparison of frequency distributions in the dietary balance index of water between two post-test groups; (m) represents the comparison of frequency distributions in the dietary balance index of oil between two post-test groups; (n) signifies the comparison of frequency distributions in the dietary balance index of salt between two post-test groups.
Figure 3
Figure 3
Illustrates the total eating behavior score before and after intervention in two groups. Note: CDIP is the Comprehensive Dietary Intervention Program, ‘b’ signifies Comparison with the Control Group, p < 0.05.
Figure 4
Figure 4
Illustrates the restrained eating dimension before and after intervention in two groups. Note: CDIP is the Comprehensive Dietary Intervention Program, ‘a’ denotes Intra-group Comparison, p < 0.05; ‘b’ signifies Comparison with the Control Group, p < 0.05.
Figure 5
Figure 5
Illustrates the Emotional Eating Dimension Before and After Intervention in Two Groups. Note: CDIP is the Comprehensive Dietary Intervention Program, ‘a’ denotes Intra-group comparison, p < 0.05.
Figure 6
Figure 6
Illustrates the external eating dimension before and after intervention in two groups. Note: CDIP is the Comprehensive Dietary Intervention Program.
Figure 7
Figure 7
Illustrates the total nutritional literacy score before and after intervention in two groups. Note: CDIP is the Comprehensive Dietary Intervention Program, ‘a’ denotes Intra-group comparison, p < 0.05; ‘b’ signifies Comparison with the Control Group, p < 0.05.
Figure 8
Figure 8
Illustrates the knowledge literacy dimension before and after intervention in two groups. Note: CDIP is the Comprehensive Dietary Intervention Program, ‘a’ denotes Intra-group comparison, p < 0.05; ‘b’ signifies Comparison with the Control Group, p < 0.05.
Figure 9
Figure 9
Illustrates the behavioral literacy dimension before and after intervention in two groups. Note: CDIP is the Comprehensive Dietary Intervention Program, ‘a’ denotes Intra-group comparison, p < 0.05; ‘b’ signifies Comparison with the Control Group, p < 0.05.
Figure 10
Figure 10
Illustrates the skills literacy dimension after intervention in two groups. Note: CDIP is the Comprehensive Dietary Intervention Program; RC is the routine care.
Figure 11
Figure 11
Post-test comparison of balance coefficients for various nutrients in two groups (n = 86). Note: (a) represents the comparison of frequency distributions in the dietary balance index of grains and tubers between two post-test groups; (b) signifies the comparison of frequency distributions in the dietary balance index of meat and poultry between two post-test groups; (c) denotes the comparison of frequency distributions in the dietary balance index of animal blood or liver between two post-test groups; (d) indicates the comparison of frequency distributions in the dietary balance index of seafood between two post-test groups; (e) stands for the comparison of frequency distributions in the dietary balance index of eggs between two post-test groups; (f) illustrates the comparison of frequency distributions in the dietary balance index of soy and soy products between two post-test groups; (g) showcases the comparison of frequency distributions in the dietary balance index of vegetables between two post-test groups; (h) highlights the comparison of frequency distributions in the dietary balance index of seaweed between two post-test groups; (i) focuses on the comparison of frequency distributions in the dietary balance index of fruits between two post-test groups; (j) portrays the comparison of frequency distributions in the dietary balance index of nuts between two post-test groups; (k) outlines the comparison of frequency distributions in the dietary balance index of dairy between two post-test groups; (l) emphasizes the comparison of frequency distributions in the dietary balance index of water between two post-test groups; (m) represents the comparison of frequency distributions in the dietary balance index of oil between two post-test groups; (n) signifies the comparison of frequency distributions in the dietary balance index of salt between two post-test groups.
Figure 11
Figure 11
Post-test comparison of balance coefficients for various nutrients in two groups (n = 86). Note: (a) represents the comparison of frequency distributions in the dietary balance index of grains and tubers between two post-test groups; (b) signifies the comparison of frequency distributions in the dietary balance index of meat and poultry between two post-test groups; (c) denotes the comparison of frequency distributions in the dietary balance index of animal blood or liver between two post-test groups; (d) indicates the comparison of frequency distributions in the dietary balance index of seafood between two post-test groups; (e) stands for the comparison of frequency distributions in the dietary balance index of eggs between two post-test groups; (f) illustrates the comparison of frequency distributions in the dietary balance index of soy and soy products between two post-test groups; (g) showcases the comparison of frequency distributions in the dietary balance index of vegetables between two post-test groups; (h) highlights the comparison of frequency distributions in the dietary balance index of seaweed between two post-test groups; (i) focuses on the comparison of frequency distributions in the dietary balance index of fruits between two post-test groups; (j) portrays the comparison of frequency distributions in the dietary balance index of nuts between two post-test groups; (k) outlines the comparison of frequency distributions in the dietary balance index of dairy between two post-test groups; (l) emphasizes the comparison of frequency distributions in the dietary balance index of water between two post-test groups; (m) represents the comparison of frequency distributions in the dietary balance index of oil between two post-test groups; (n) signifies the comparison of frequency distributions in the dietary balance index of salt between two post-test groups.
Figure 12
Figure 12
Illustrates the Diet Quality Distance before and after intervention in two groups. Note: CDIP is the Comprehensive Dietary Intervention Program, ‘a’ denotes Intra-group comparison, p < 0.05; ‘b’ signifies Comparison with the Control Group, p < 0.05.
Figure 13
Figure 13
Frequency distribution of weight gain within 12 Weeks in two groups. Note: CDIP is the Comprehensive Dietary Intervention Program.

Similar articles

Cited by

References

    1. Cao L.J., Lin H.Y., Liang X., Chen Y.J., Liu Y.Y., Zheng Y.Z., Wang X.Y., Li W., Yan J., Huang G.W. Association between Pre-pregnancy Body Mass Index and Offspring Neuropsychological Development from 1 to 24 Months of Age: A Birth Cohort Study in China. Biomed. Environ. Sci. 2019;32:730–738. - PubMed
    1. Eloranta A.M., Gunnarsdottir I., Thorisdottir B., Gunnlaugsson G., Birgisdottir B.E., Thorsdottir I., Einarsdóttir K. The combined effect of pre-pregnancy body mass index and gestational weight gain on the risk of pre-labour and intrapartum caesarean section-The ICE-MCH study. PLoS ONE. 2023;18:e0280060. doi: 10.1371/journal.pone.0280060. - DOI - PMC - PubMed
    1. Ke J.-F., Liu S., Ge R.-L., Ma L., Li M.-F. Associations of maternal pre-pregnancy BMI and gestational weight gain with the risks of adverse pregnancy outcomes in Chinese women with gestational diabetes mellitus. BMC Pregnancy Childbirth. 2023;23:414. doi: 10.1186/s12884-023-05657-8. - DOI - PMC - PubMed
    1. Fan X., Dai J., He J., Tian R., Xu J., Song J., Bai J., Liu Y., Zou Z., Chen X. Optimal gestational weight gain in Chinese pregnant women with gestational diabetes mellitus: A large retrospective cohort study. J. Obstet. Gynaecol. Res. 2023;49:182–193. doi: 10.1111/jog.15448. - DOI - PubMed
    1. Jiajin H. Effects of Weight Gain during Pregnancy on Maternal and Child Health Outcomes and Research on Weight Management Methods during Pregnancy. China Medical University; Taichung, Taiwan: 2019.

Publication types

LinkOut - more resources