. 2024 Jan 9;29(2):323.
doi: 10.3390/molecules29020323.

A Two-Step Mechanism for Creating Stable, Condensed Chromatin with the Polycomb Complex PRC1

Affiliations

A Two-Step Mechanism for Creating Stable, Condensed Chromatin with the Polycomb Complex PRC1

Elias Seif et al. Molecules. .

Abstract

The Drosophila PRC1 complex regulates gene expression by modifying histone proteins and chromatin architecture. Two PRC1 subunits, PSC and Ph, are most implicated in chromatin architecture. In vitro, PRC1 compacts chromatin and inhibits transcription and nucleosome remodeling. The long disordered C-terminal region of PSC (PSC-CTR) is important for these activities, while Ph has little effect. In cells, Ph is important for condensate formation, long-range chromatin interactions, and gene regulation, and its polymerizing sterile alpha motif (SAM) is implicated in these activities. In vitro, truncated Ph containing the SAM and two other conserved domains (mini-Ph) undergoes phase separation with chromatin, suggesting a mechanism for SAM-dependent condensate formation in vivo. How the distinct activities of PSC and Ph on chromatin function together in PRC1 is not known. To address this question, we analyzed structures formed with large chromatin templates and PRC1 in vitro. PRC1 bridges chromatin into extensive fibrillar networks. Ph, its SAM, and SAM polymerization activity have little effect on these structures. Instead, the PSC-CTR controls their growth, and is sufficient for their formation. To understand how phase separation driven by Ph SAM intersects with the chromatin bridging activity of the PSC-CTR, we used mini-Ph to form condensates with chromatin and then challenged them with PRC1 lacking Ph (PRC1ΔPh). PRC1ΔPh converts mini-Ph chromatin condensates into clusters of small non-fusing condensates and bridged fibers. These condensates retain a high level of chromatin compaction and do not intermix. Thus, phase separation of chromatin by mini-Ph, followed by the action of the PSC-CTR, creates a unique chromatin organization with regions of high nucleosome density and extraordinary stability. We discuss how this coordinated sequential activity of two proteins found in the same complex may occur and the possible implications of stable chromatin architectures in maintaining transcription states.

Keywords: Polycomb; chromatin; intrinsically disordered region (IDR); phase separation biomolecular condensate; sterile alpha motif (SAM).


Conflict of interest statement

The authors declare no conflict of interest. The funders had no role in the design of the study; in the collection, analyses, or interpretation of data; in the writing of the manuscript; or in the decision to publish the results.

Figures
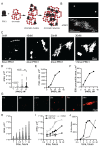
Figure 1
Figure 1
PRC1 bridges chromatin templates into large fibrillar condensates at low ratios to nucleosomes. (A) Schematic of reactions with PRC1 and circular chromatin templates labelled with Cy3 on H2A. Multiple PRC1 binds each plasmid and these plasmids are bridged first into small clusters and then into large chromatin networks. (B) Confocal images of chromatin alone or with PRC1 (~20 PRC1/plasmid or 1 PRC1:3 nucleosomes). (C) Representative images of structures formed at different concentrations of PRC1 after overnight incubation at 25 °C. The contrast in the 5 nM panel was enhanced to allow visualization of the multiple tiny structures. (D) Graph of structure size across a PRC1 titration. p-values are for Kruskal–Wallace test with Dunn’s correction for multiple comparisons. (E,F) Graphs of maximum structure size (E) or 90th percentile size (F) across PRC1 titration. Nucleosomes are present at ~40 nM in these reactions, and plasmids at ~0.7 nM. (G) Images from a time course of structure formation. (H) Quantification of structure size across the time course shown in (G,I). Median, 90th percentile, and maximum structure size from two time course experiments. Points are mean ± SD. (J) Number of structures from two time course experiments.
Figure 2
Figure 2
Other PcG complexes, PhoRC and PRC2, do not form large condensates with chromatin at low ratios to nucleosomes. (A) Representative images of structures formed with chromatin alone and three main PcG complexes. Nucleosome concentration is 40 nM in all reactions. (BD) Quantification of area (B), intensity (C), and circularity (D) from experiment shown in (A). **** p < 0.0001 for comparison with PRC1 by Kruskal–Wallace test with Dunn’s correction for multiple comparisons. Area, but not intensity, was significantly different between PRC1 and PRC2 in the second experiment. (E) EMSA of chromatin incubated with each of the three complexes, indicating that all chromatin is bound (shifted to the well) under conditions used for microscopy. Images are of agarose gels stained with SYBR gold to visualize DNA. (F) Representative images of structures formed with chromatin and increasing concentrations of PRC2. Nucleosome concentration is ~30 nM. (G,H) Quantification of area (G) and circularity (H) of structures formed with increasing concentrations of PRC2. All reactions were incubated overnight at 25 °C and contained 2 mM MgCl2. Chromatin was visualized with H2A-Cy3 in all images.
Figure 3
Figure 3
The PSC-CTR increases the rate of formation and size of PRC1-chromatin condensates. (A) Schematic of PRC1. (B) Domain organization of Ph and PSC and truncations/mutations used in this study. Gray regions and the SAM are structured domains; the rest of both proteins are predicted or shown to be disordered. * indicates mutation in the Ph SAM. (C) Representative structures formed with different complexes after 4 or 24 h. (D) Histograms of the number of structures formed by different complexes after 4 h of incubation. (E) Histograms showing the number of structures greater than 500 µm2 formed by different complexes with chromatin after 24 h (*** p = 0.0001). (FI) Quantification of area (F,H) or circularity (G,I) of structures formed by different complexes at different time points. Asterisks are for Kruskal–Wallace test with Dunn’s correction for multiple comparisons (**** p < 0.0001). See Figure S4 for a second representative experiment including additional complexes.
Figure 4
Figure 4
The PSC-CTR forms chromatin networks similar to PRC1 and round condensates at high salt. (A) Representative images of structures formed by PRC1 (10 nM) or the PSC-CTR (40 nM) with chromatin. (B–D) Quantification of structure areas after 6 (B) or 24 (C) h, and of circularity (D) for both time points. See Figure 5 for replicate experiment. p-values are for Kruskal–Wallace test with Dunn’s correction for multiple comparisons. (E) Condensate formation by the PSC-CTR (1.2 µM) in the presence of Ficoll (100 mg/mL) at increasing [KCl] after overnight incubation. (F,G) Quantification of area (F) and circularity (G) of titration shown in (E,H). Condensates formed by the PSC-CTR (~1 µM) with chromatin (~200 nM) in 300 mM KCl after overnight incubation with chromatin at two different nucleosome densities (70%, top, or 86%, bottom, assembled). (I,J) Quantification of area (I) and circularity (J) of structures from two experiments with two levels of nucleosome assembly. Higher nucleosome densities gave large and rounder structures, but, although noticeable, these effects were not significant.
Figure 5
Figure 5
PRC1ΔPh and the PSC-CTR arrest mini-Ph condensates. (A) Schematic of two-step reaction to test the effect of PRC1ΔPh or the PSC-CTR on mini-Ph-chromatin condensates. (B,C) Representative images of chromatin incubated with mini-Ph, or mini-Ph followed by increasing concentrations of PRC1ΔPh (B) or the PSC-CTR (C). All reactions contain 5 µM mini-Ph and 275 nM nucleosomes (5 nM plasmid). (DG) Graph of condensate areas (D,F) and circularity (E,G) from the experiments shown in (B,C). Pre-incubation of mini-Ph with chromatin was for 5 min, and the second incubation was for 30 min. at room temperature. Chromatin was visualized with YOYO1 staining. Asterisks and p-values are for Kruskal–Wallace test with Dunn’s correction for multiple comparisons (*** p = 0.001; **** = p ≤ 0.0001). (H,I) Summary of the 98th percentile of condensate size after incubation with PRC1ΔPh (H) or the PSC-CTR. Points are the mean ± SD. PRC1ΔPh n = 2, PSC-CTR n = 3. (J) Representative images showing co-localization of proteins and chromatin in mini-Ph condensates (top), PRC1ΔPh-chromatin fibers (middle), or mini-Ph-chromatin condensates incubated with PRC1 (bottom). Two-channel merges are shown below single-channel images. Chromatin was visualized with YOYO1, PRC1ΔPh was labelled with Cy3, and mini-Ph with Alexa-647. Note that these experiments and those in the remainder of the manuscript were imaged in a 384-well plate using a spinning disc confocal microscope, rather than with epifluorescence under coverslips, explaining the differences in morphology in the structures.
Figure 6
Figure 6
Chromatin is more compact in phase-separated mini-Ph condensates than PRC1ΔPh chromatin fibers. (A) Representative volumes selected by Imaris from Z-stacks of images of condensates. (BD) Three experiments measuring signal intensity/volume for condensates formed with mini-Ph, PR1ΔPh, or mini-Ph followed by PRC1ΔPh. Asterisks and p-values are for Kruskal–Wallace test with Dunn’s correction for multiple comparisons (* = p = 0.012; **** = p ≤ 0.0001). (E) Standard deviation of intensity/volume measurements for all three experiments. Condensates formed with mini-Ph followed by PRC1ΔPh have the highest standard deviation, consistent with regions of high and low density as evident in (F). (F) Intensity of chromatin staining in different condensates. The five most intense sequential slices from the stacks shown in A are shown as a montage with intensity scaled identically in all images as indicated on the calibration bar. This shows that mini-Ph condensates have a relatively uniform high intensity of chromatin signal, and that mini-Ph + PRC1ΔPh condensates have more high-intensity regions than PRC1ΔPh with chromatin alone.
Figure 7
Figure 7
PRC1ΔPh blocks mixing of chromatin in condensates. (A) Representative images after mixing pre-formed mini-Ph-chromatin condensates. The dark spots observed in condensates appear in some experiments but not others; they do not contain signals for chromatin or DNA and might be areas of reentrant phase separation. (B) Representative images after mixing pre-formed PRC1DPh-chromatin fibers. (C) Representative images after mixing pre-formed mini-Ph-chromatin condensates with PRC1ΔPh added at the time of mixing. (D) Representative images of pre-formed mini-Ph-chromatin condensates after addition of PRC1ΔPh to each reaction and subsequent mixing. (EG) Graphs of Pearson’s coefficients for correlation between two chromatin templates with different mixing protocols from three experiments. Each dot represents a single image. The numbers on the X-axis are the minutes of incubation before mixing (0 means chromatins were mixed before adding mini-Ph, 5 means each chromatin was incubated with mini-Ph for 5 min. before mixing). (E) is for the images shown; for (F,G), the first incubation was 5 min., the second (with PRC1ΔPh) was 10 min., and the final incubation was 40–45 min. For the experiment shown in (G), no reactions with pre-mixed templates were included. See Figure S9 for experiments with pre-mixed templates and each template alone. Mini-Ph was used at 4 µM, PRC1 at 330 nM, and nucleosomes at ~275 nM (1:1 ratio for the two chromatin templates). Chromatin shown was 72% (Alexa-647, white) and 78% (Cy3, red) assembled. (H) Summary of Pearson’s coefficients across three experiments. Reaction schemes are as follows: XM = mix chromatin before adding mini-Ph, MX = mix after incubating with mini-Ph, XMP = mix chromatins before incubating with mini-Ph and then PRC1ΔPh; MXP = incubate with mini-Ph, mix and add PRC1ΔPh immediately; MPX = incubate with mini-Ph and then with PRC1ΔPh and then mix. Each point is the average Pearson’s coefficient from a single experiment; points from the same experiment are shaded the same. p-values are for one-way ANOVA with Sidak’s correction for multiple comparisons. Additional comparisons were made as follows: XM vs. MX, p = 0.0024; XMP vs. MXP or MPX, p ≤ 0.0001, MXP vs. MPX, p = 0.6664.
Figure 8
Figure 8
A two-step model for chromatin compaction by PRC1. In vitro, mini-Ph undergoes phase separation with chromatin that depends on the SAM. Addition of PRC1ΔPh arrests condensates into small stable clusters bridged by chromatin fibers. We hypothesize that Drosophila PRC1 uses the activities of Ph and the PSC-CTR sequentially to create stable chromatin reminiscent of arrested condensates. Mammalian PRC1 may instead use CBX proteins followed by PHC SAM to create similarly stable condensates.

Similar articles

References

    1. Schuettengruber B., Bourbon H.M., Di Croce L., Cavalli G. Genome Regulation by Polycomb and Trithorax: 70 Years and Counting. Cell. 2017;171:34–57. doi: 10.1016/j.cell.2017.08.002. - DOI - PubMed
    1. Loubiere V., Martinez A.M., Cavalli G. Cell Fate and Developmental Regulation Dynamics by Polycomb Proteins and 3D Genome Architecture. Bioessays. 2019;41:e1800222. doi: 10.1002/bies.201800222. - DOI - PubMed
    1. Pengelly A.R., Copur O., Jackle H., Herzig A., Muller J. A histone mutant reproduces the phenotype caused by loss of histone-modifying factor Polycomb. Science. 2013;339:698–699. doi: 10.1126/science.1231382. - DOI - PubMed
    1. Pengelly A.R., Kalb R., Finkl K., Muller J. Transcriptional repression by PRC1 in the absence of H2A monoubiquitylation. Genes Dev. 2015;29:1487–1492. doi: 10.1101/gad.265439.115. - DOI - PMC - PubMed
    1. Cheutin T., Cavalli G. The multiscale effects of polycomb mechanisms on 3D chromatin folding. Crit. Rev. Biochem. Mol. Biol. 2019;54:399–417. doi: 10.1080/10409238.2019.1679082. - DOI - PubMed

LinkOut - more resources