. 2024 Jan 5;12(1):114.
doi: 10.3390/microorganisms12010114.

An Indirect Fluorescence Microscopy Method to Assess Vaginal Lactobacillus Concentrations

Affiliations

An Indirect Fluorescence Microscopy Method to Assess Vaginal Lactobacillus Concentrations

Ângela Lima et al. Microorganisms. .

Abstract

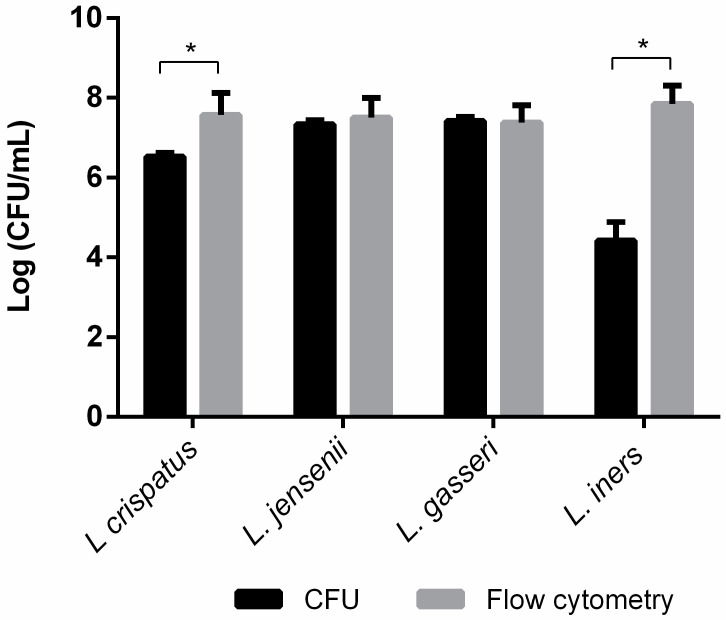
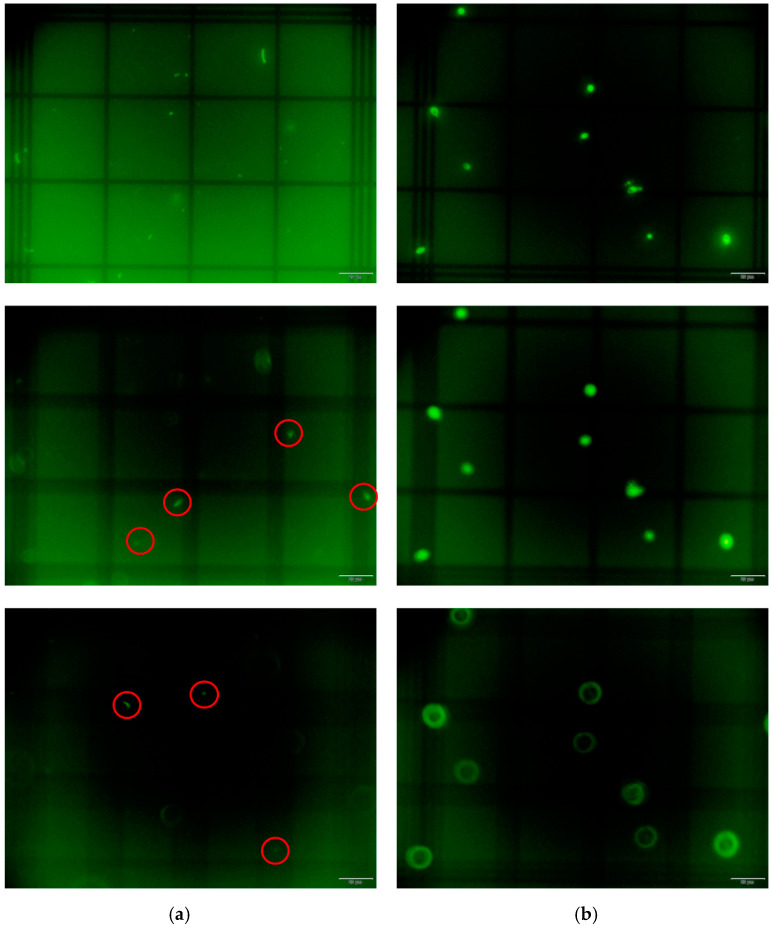
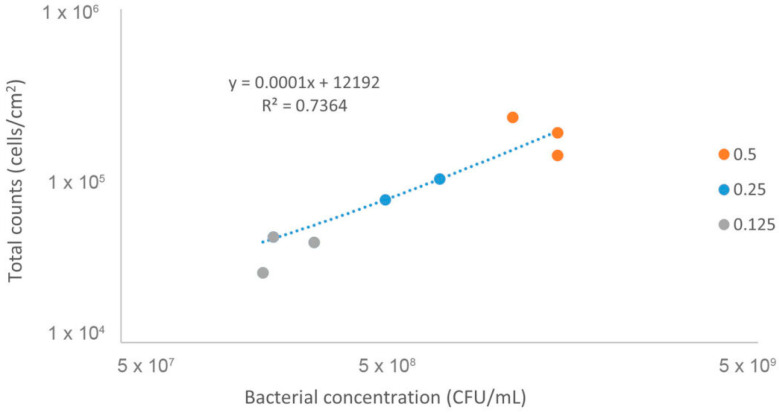
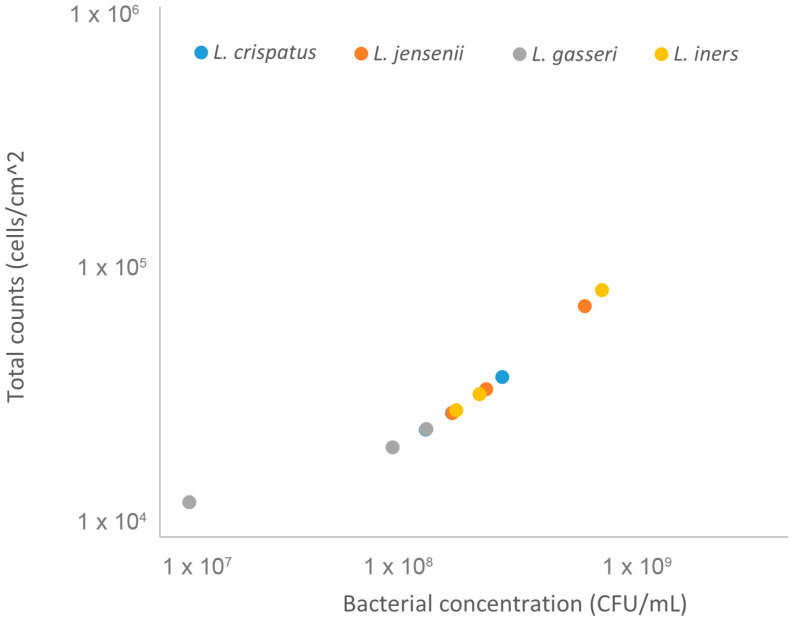
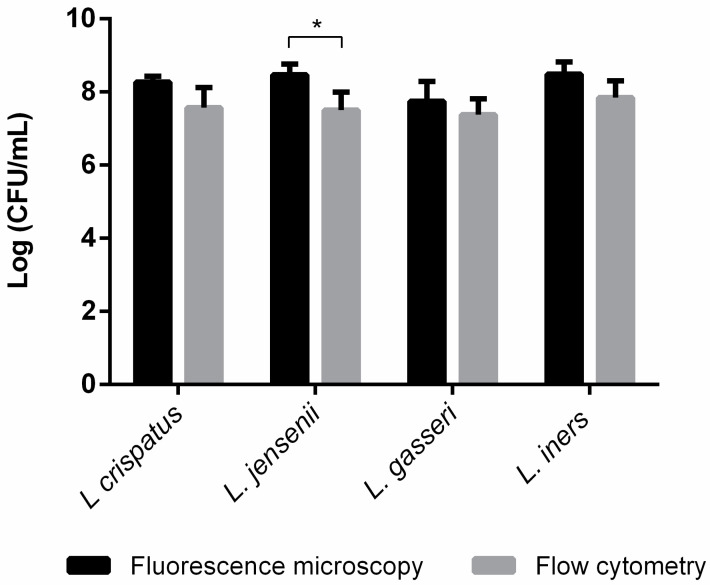
Lactobacillus species are the main colonizers of the vaginal microbiota in healthy women. Their absolute quantification by culture-based methods is limited due to their fastidious growth. Flow cytometry can quantify the bacterial concentration of these bacteria but requires the acquisition of expensive equipment. More affordable non-culturable methods, such as fluorescence microscopy, are hampered by the small size of the bacteria. Herein, we developed an indirect fluorescence microscopy method to determine vaginal lactobacilli concentration by determining the correlation between surface area bacterial measurement and initial concentration of an easily cultivable bacterium (Escherichia coli) and applying it to lactobacilli fluorescence microscopy counts. In addition, vaginal lactobacilli were quantified by colony-forming units and flow cytometry in order to compare these results with the indirect method results. The colony-forming-unit values were lower than the results obtained from the other two techniques, while flow cytometry and fluorescence microscopy results agreed. Thus, our developed method was able to accurately quantify vaginal lactobacilli.

Keywords: bacterial quantification; colony forming units; flow cytometry; fluorescence microscopy; vaginal lactobacilli.


Conflict of interest statement

C.A.M. reports receiving grants to her institution from NIH/NIAID, Lupin, Abbott Molecular, Visby, and Gilead Sciences, Inc. She also reports honorarium and/or consulting fees from Scynexis, Cepheid, BioNTech, BioMed Diagnostics, Visby Medical, Elsevier, UpToDate, Abbott Molecular, and Roche. The other authors declare no conflict of interest. The funders had no role in the design of the study; in the collection, analyses, or interpretation of data; in the writing of the manuscript; or in the decision to publish the results.

Figures

Figure 1
Figure 1
Quantification of bacterial concentrations of L. crispatus, L. jensenii, L. gasseri, and L. iners suspensions with an OD of 0.5 by culture-dependent (CFU) and -independent (Flow cytometry) techniques. The bars represent the mean and the standard deviation of 3 independent experiments. * Represents statistical significance (t-test paired samples, parametric, p ≤ 0.05).
Figure 2
Figure 2
Comparison of the use of Neubauer chamber for (a) L. crispatus and (b) C. albicans using three z-stacks. The observation of these microorganisms was performed using fluorescence microscopy. For L. crispatus (a), the variation of focal points demonstrates different numbers of counts, while for C. albicans (b) the number of cells is the same for the three z-stacks. The red circles surround the bacteria that are not visible in the first focal plan. Scale bar: 20 µm.
Figure 3
Figure 3
The relationship between E. coli CFUs and total cell counts using fluorescence microscopy for the same OD. Three bacterial suspensions initially adjusted to different OD620nm, namely, 0.5, 0.25, and 0.125, were quantified by both FM and by plate counting. The dots correspond to three independent assays for each OD.
Figure 4
Figure 4
Lactobacillus spp. Concentrations obtained through total counts. Four bacterial suspensions adjusted to OD620nm = 0.5 were quantified by fluorescence microscopy and the results obtained were converted into CFUs, as mentioned above. The dots correspond to three independent assays for each Lactobacillus spp.
Figure 5
Figure 5
Quantification of bacterial concentrations of L. crispatus, L. jensenii, L. gasseri, and L. iners suspensions with an OD of 0.5, using fluorescence microscopy and flow cytometry techniques. The bars represent the mean and the standard deviation of 3 independent experiments. * Represents statistical significance (t-test paired samples, parametric, p ≤ 0.05).

Similar articles

Cited by

References

    1. Chee W., Chew S., Than L. Vaginal Microbiota and the Potential of Lactobacillus Derivatives in Maintaining Vaginal Health. Microb. Cell Fact. 2020;19:203. doi: 10.1186/s12934-020-01464-4. - DOI - PMC - PubMed
    1. Ravel J., Gajer P., Abdo Z., Schneider G.M., Koenig S.S., McCulle S.L., Forney L.J. Vaginal Microbiome of Reproductive-Age Women. Proc. Natl. Acad. Sci. USA. 2011;108:4680–4687. doi: 10.1073/pnas.1002611107. - DOI - PMC - PubMed
    1. Witkin S., Linhares I. Why Do Lactobacilli Dominate the Human Vaginal Microbiota? BJOG Int. J. Obstet. Gynaecol. 2016;124:606–611. doi: 10.1111/1471-0528.14390. - DOI - PubMed
    1. Petrova M.I., Reid G., Vaneechoutte M., Lebeer S. Lactobacillus Iners: Friend or Foe? Trends Microbiol. 2017;25:182–191. doi: 10.1016/j.tim.2016.11.007. - DOI - PubMed
    1. Zheng N., Guo R., Wang J., Zhou W., Ling Z. Contribution of Lactobacillus Iners to Vaginal Health and Diseases: A Systematic Review. Front. Cell. Infect. Microbiol. 2021;11:1177. doi: 10.3389/fcimb.2021.792787. - DOI - PMC - PubMed

LinkOut - more resources