. 2024 Jan 23;9(2):e172569.
doi: 10.1172/jci.insight.172569.

Urine proteomic signatures of histological class, activity, chronicity, and treatment response in lupus nephritis

Affiliations

Urine proteomic signatures of histological class, activity, chronicity, and treatment response in lupus nephritis

Andrea Fava et al. JCI Insight. .

Abstract

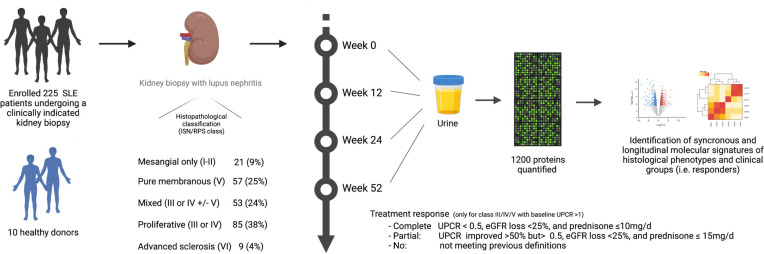
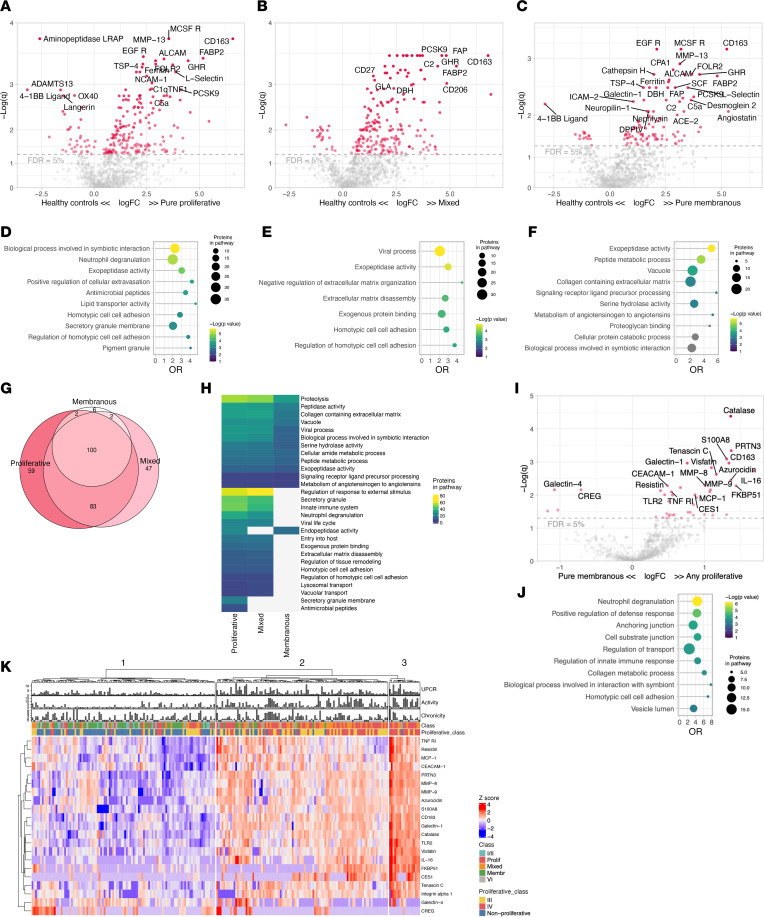
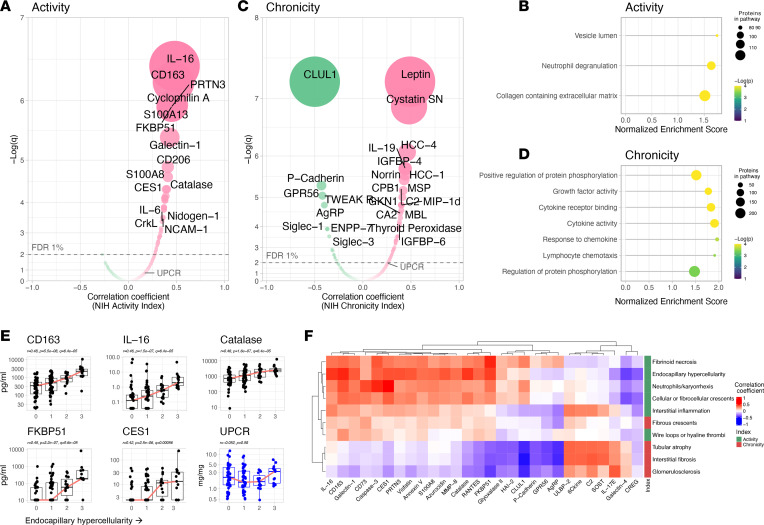
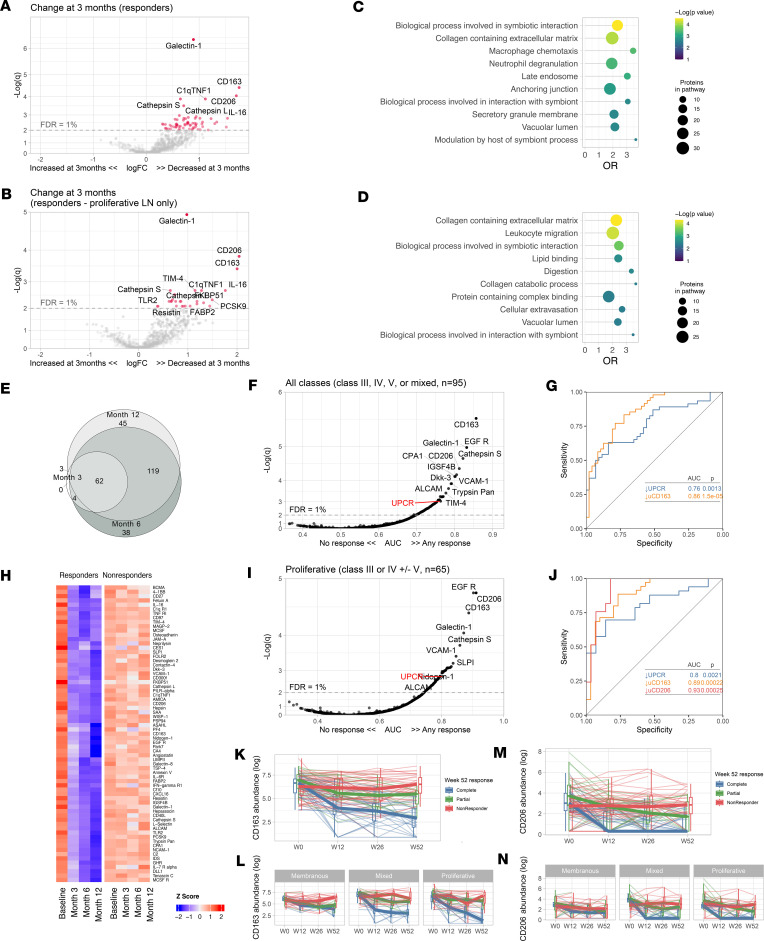
Lupus nephritis (LN) is a pathologically heterogenous autoimmune disease linked to end-stage kidney disease and mortality. Better therapeutic strategies are needed as only 30%-40% of patients completely respond to treatment. Noninvasive biomarkers of intrarenal inflammation may guide more precise approaches. Because urine collects the byproducts of kidney inflammation, we studied the urine proteomic profiles of 225 patients with LN (573 samples) in the longitudinal Accelerating Medicines Partnership in RA/SLE cohort. Urinary biomarkers of monocyte/neutrophil degranulation (i.e., PR3, S100A8, azurocidin, catalase, cathepsins, MMP8), macrophage activation (i.e., CD163, CD206, galectin-1), wound healing/matrix degradation (i.e., nidogen-1, decorin), and IL-16 characterized the aggressive proliferative LN classes and significantly correlated with histological activity. A decline of these biomarkers after 3 months of treatment predicted the 1-year response more robustly than proteinuria, the standard of care (AUC: CD206 0.91, EGFR 0.9, CD163 0.89, proteinuria 0.8). Candidate biomarkers were validated and provide potentially treatable targets. We propose these biomarkers of intrarenal immunological activity as noninvasive tools to diagnose LN and guide treatment and as surrogate endpoints for clinical trials. These findings provide insights into the processes involved in LN activity. This data set is a public resource to generate and test hypotheses and validate biomarkers.

Keywords: Autoimmunity; Diagnostics; Lupus; Nephrology; Proteomics.


Conflict of interest statement

Conflict of interest: The authors have declared that no conflict of interest exists.

Figures

Figure 1
Figure 1. Experimental pipeline.
eGFR, estimated glomerular filtration rate.
Figure 2
Figure 2. Proteomic signatures of LN histological classes.
Volcano plots of the differential urinary protein abundances in pure proliferative (n = 85) (A), mixed (n = 55) (B), and membranous (n = 55) (C) LN compared with healthy controls (n = 10). Pathway enrichment analysis of the proteins enriched in pure proliferative (D), mixed (E), and membranous (F) LN (FDR < 5%); pathways in gray had a q > 0.05. (G) Venn diagram summarizing the shared significantly changed proteins enriched in the 3 classes displayed in AC. (H) Heatmap summarizing the pathways enriched (FDR < 25%) in the 3 classes. (I) Volcano plot displaying the differential urine protein abundances in any proliferative (pure or mixed) and pure membranous with relative pathway enrichment analysis (J). (K) Heatmap displaying the unsupervised clustering based on the urine abundances of the proteins differentially abundant in any proliferative versus pure membranous (I); clinical features are displayed. Not available activity and chronicity scores are indicated as –1. FDR, false discovery rate; OR, odds ratio; q, adjusted P value (Benjamini-Hochberg).
Figure 3
Figure 3. Proteomic signatures of histological activity and chronicity.
Volcano plots displaying Pearson’s correlation of the proteins’ urinary abundances and the NIH Activity (A) and Chronicity (C) indices (n = 154). The correlation with the urine protein-to-creatinine ratio (UPCR) is indicated for reference. Pathway enrichment analysis (by gene set enrichment analysis) of the associations of the urinary proteins with the NIH Activity (B) and Chronicity (D) Indices. (E) The 5 most correlated proteins with the endocapillary hypercellularity score are displayed as compared with UPCR. (F) Hierarchical clustering based on the correlations of each histological lesion and urinary proteins. All proteins with a strict statistically significant correlation (FDR < 0.01) with at least 1 histological lesion were included. FDR, false discovery rate; q, Benjamini-Hochberg adjusted P value.
Figure 4
Figure 4. Proteomic changes of treatment response.
Volcano plots of the changes of the urinary proteomic profiles of treatment responders at 3 months after kidney biopsy/treatment compared with baseline at time of biopsy in proliferative and membranous combined (A) or proliferative only (B). (C and D) Pathway enrichment analysis of the urinary proteins declined in A and B, respectively. (E) Venn diagram summarizing the shared significantly changed proteins at 3, 6, and 12 months after the kidney biopsy. (F) Heatmap displaying the urinary abundances of the proteins significantly decreased at 3 months in responders from panel A at the 4 time points according to response status. (G) Discriminatory power of the change of each urinary protein at 3 months compared with baseline to predict treatment response at month 12 (n = 95) (displayed as area under the curve, AUC). The change in UPCR is displayed for reference as the traditionally used biomarker. (H) Receiver operating characteristic curves of the decline at 3 months of the UPCR (traditional biomarker) and urinary CD163. I and J replicate G and H, but limited to patients with proliferative LN (n = 65). (KN) Trajectory of the urinary abundance of CD163 (K and L) and CD206 (M and N) according to response status in all patients and stratified by ISN class. Thin lines indicate individual trajectories; thick lines indicate the group medians; box plots indicate medians, interquartile range, and range. q, adjusted P values (Benjamini-Hochberg); OR, odds ratio; FDR, false discovery rate.

References

    1. Mahajan A, et al. Systemic lupus erythematosus, lupus nephritis and end-stage renal disease: a pragmatic review mapping disease severity and progression. Lupus. 2020;29(9):1011–1020. doi: 10.1177/0961203320932219. - DOI - PMC - PubMed
    1. Korbet SM, et al. Severe lupus nephritis: racial differences in presentation and outcome. J Am Soc Nephrol. 2007;18(1):244–254. doi: 10.1681/ASN.2006090992. - DOI - PubMed
    1. Costenbader KH, et al. Trends in the incidence, demographics, and outcomes of end-stage renal disease due to lupus nephritis in the US from 1995 to 2006. Arthritis Rheum. 2011;63(6):1681–1688. doi: 10.1002/art.30293. - DOI - PMC - PubMed
    1. Rovin BH, et al. Efficacy and safety of voclosporin versus placebo for lupus nephritis (AURORA 1): a double-blind, randomised, multicentre, placebo-controlled, phase 3 trial. Lancet. 2021;397(10289):2070–2080. doi: 10.1016/S0140-6736(21)00578-X. - DOI - PubMed
    1. Furie R, et al. Two-year, randomized, controlled trial of belimumab in lupus nephritis. N Engl J Med. 2020;383(12):1117–1128. doi: 10.1056/NEJMoa2001180. - DOI - PubMed

Publication types