. 2024 Jan 23;9(2):e170428.
doi: 10.1172/jci.insight.170428.

Farnesoid X receptor mediates macrophage-intrinsic responses to suppress colitis-induced colon cancer progression

Affiliations

Farnesoid X receptor mediates macrophage-intrinsic responses to suppress colitis-induced colon cancer progression

Xingchen Dong et al. JCI Insight. .

Abstract

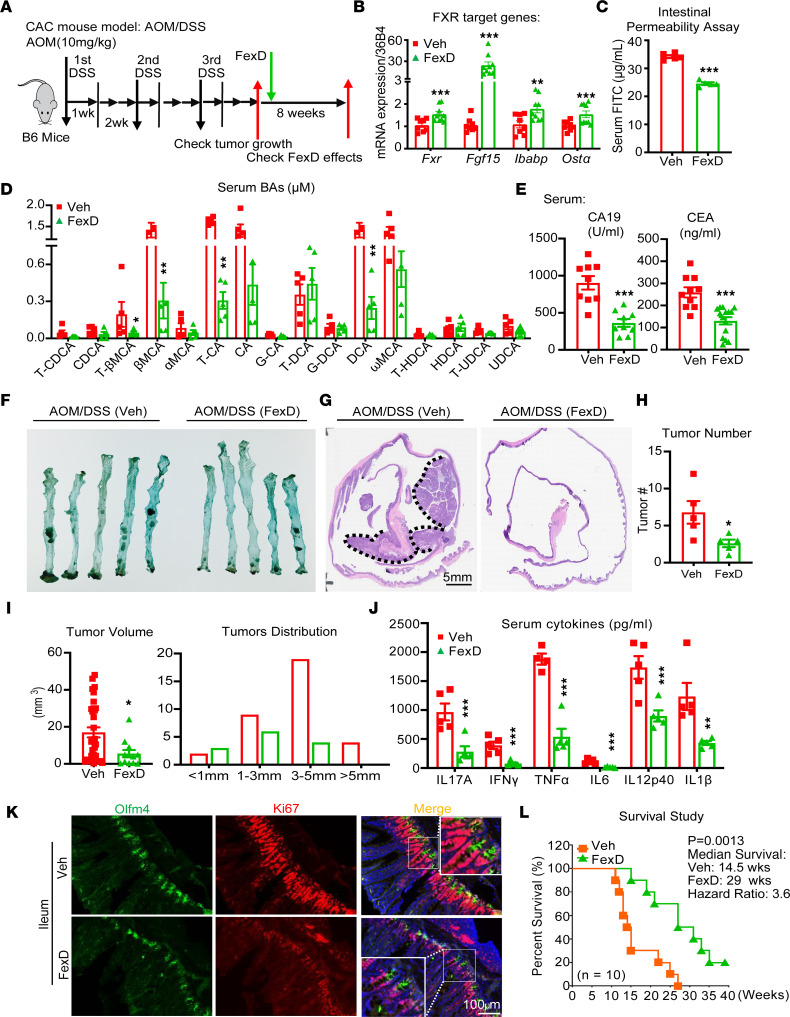
Bile acids (BAs) affect the intestinal environment by ensuring barrier integrity, maintaining microbiota balance, regulating epithelium turnover, and modulating the immune system. As a master regulator of BA homeostasis, farnesoid X receptor (FXR) is severely compromised in patients with inflammatory bowel disease (IBD) and colitis-associated colorectal cancer (CAC). At the front line, gut macrophages react to the microbiota and metabolites that breach the epithelium. We aim to study the role of the BA/FXR axis in macrophages. This study demonstrates that inflammation-induced epithelial abnormalities compromised FXR signaling and altered BAs' profile in a mouse CAC model. Further, gut macrophage-intrinsic FXR sensed aberrant BAs, leading to pro-inflammatory cytokines' secretion, which promoted intestinal stem cell proliferation. Mechanistically, activation of FXR ameliorated intestinal inflammation and inhibited colitis-associated tumor growth, by regulating gut macrophages' recruitment, polarization, and crosstalk with Th17 cells. However, deletion of FXR in bone marrow or gut macrophages escalated the intestinal inflammation. In summary, our study reveals a distinctive regulatory role of FXR in gut macrophages, suggesting its potential as a therapeutic target for addressing IBD and CAC.

Keywords: Colorectal cancer; Endocrinology; Gastroenterology.


Figures

Figure 1
Figure 1. Cytokines increased in CAC model stimulate ISCs’ proliferation.
(A) H&E staining of colon parts, scale bar 5 mm. (B) Expression of FXR and its downstream targets (Fgf15, Ibabp, Ostα) is reduced in CAC mice. (CE) Intestinal permeability (C), total serum BAs (D), and serum cytokine levels (E) in CAC mice. (F) Relative expression (fragments per kilobase million [FPKM] values) of presented genes based on RNA-Seq data of healthy and CAC patients (Supplemental Table 3). Box plots show the interquartile range (box), median (line), and minimum and maximum (whiskers). (G) Proliferation of intestinal organoids from WT mice, measured by ATP luminescence, in response to increasing concentrations of IL17A (50, 100 ng/mL), IFN-γ (10, 20 ng/mL), TNF-α (20, 40 ng/mL), IL6 (20, 50 ng/mL), IL23 (50, 100 ng/mL), and IL1β (10, 20 ng/mL). (H) Stem cell marker (Lgr5, Olfm4, Tnfrsf19, Ascl2) genes’ expression in WT organoids treated with vehicle (PBS) and cytokines of indicated concentration. Experiments in HK are conducted under same conditions as in H. (I and J) Bright-field images of branching WT organoids for 24 hours of treatment (I). Scale bar 50 μm. Branching was quantified as crypt domain per organoid from 5 individuals (J). (K) Images of WT organoids treated with different cytokines, co-immunostained with stem cell marker Olfm4 (red) and proliferating marker Ki67 (green); the nucleus is counterstained with DAPI (blue). Circled parts with higher magnification are presented (bottom). Scale bar 20 μm. n = 3–5/group. Experiments were independently replicated twice, and representative data are shown as mean ± SEM. P values determined with Student’s unpaired t test (BE), Wilcoxon test (F), and 1-way ANOVA test followed by Tukey’s multiple comparisons (G, H, and J). *P < 0.05; **P < 0.01; ***P < 0.005.
Figure 2
Figure 2. FXR agonism slows tumor progression in CAC.
(A) The scheme of FexD treatment in CAC mice. After tumors developed, mice were treated with FexD (50 mg/kg BW/d orally) for 8 weeks, with corn oil as vehicle control. (B) Relative expression of FXR and its target genes (Fgf15, Ibabp, and Ostα) in vehicle- and FexD-treated CAC mice. (C and D) Intestinal permeability (C) and serum BA composition and levels (D) were measured in above treatment groups: glycolithocholic acid (GLCA), murideoxycholic acid (MDCA), hyodeoxycholic acid (HDCA), α-hyocholic acid (α-HCA), α-muricholic acid (α-MCA), β-MCA, ω-MCA, Tauro-β-muricholic acid (T-βMCA), and taurocholic acid (TCA). (E) Prognostic serum tumor markers of CRC, cancer antigen 19-9 (CA19) and carcinoembryonic antigen (CEA), in above treatment groups. (F and G) Live and H&E images of tumors in the colon. Black dot line circles the tumors. Scale bar 5 mm. (H and I) Average tumor burden (H), tumor volumes, and tumor size distribution (I) in above treatment groups. (J) Serum cytokine levels were measured in above treatment groups. (K) Co-immunostaining images of ISC marker Olfm4 (green) and proliferation gene marker Ki67 (red) in the ileum of CAC mice with FexD or vehicle treatment. Scale bar 100 μm. (L) Survival curves (log-rank test) for CAC mice with FexD or vehicle treatment. n = 3–10/group. Experiments were independently replicated twice, and representative data are shown as the mean ± SEM. *P < 0.05; **P < 0.01; ***P < 0.005, Student’s unpaired t test.
Figure 3
Figure 3. FXR suppresses pro-inflammatory response in lamina propria.
(A) Representative flow cytometry analyses of the T cell populations in the lamina propria of ileum of CAC mice with FexD or vehicle treatment, as experimental scheme described in Figure 2A. (BD) Quantification of CD4+ and CD8+ T cell numbers (B) and percentage of IFN-γ– and IL17A-secreting cells in CD8+ (C) and CD4+ (D) T cells in above treatment groups. (E) Indicated cytokine levels were measured in 2 million small intestinal lamina propria cells from above treatment groups. (F and G) Expression of pro-inflammatory cytokines (F) and M1-like marker genes (G) measured by quantitative reverse transcription PCR (qRT-PCR) in small intestinal lamina propria cells from above treatment groups. (H) Co-immunostaining images of macrophage cell marker F4/80 (green) with the nucleus counterstained with DAPI (blue) in the colon. Scale bar 100 μm. n = 3–5/group. Experiments were independently replicated twice, and representative data are shown as the mean ± SEM. P values are computed with Student’s unpaired t test and 1-way ANOVA test followed by multiple comparisons. *Veh versus H2O, #FexD versus Veh; *, #P < 0.05; **, ##P < 0.01; ***, ###P < 0.005.
Figure 4
Figure 4. FXR modulates macrophages’ response to inflammatory insult.
(A) Relative expression (FPKM values) of presented genes based on RNA-Seq data of normal and inflamed colorectal tissue samples from combined IBD (TaMMA) cohorts. Box plots show the interquartile range (box), median (line), and minimum and maximum (whiskers). (B) The scheme of FexD early intervention in WT mice under chronic DSS (CDSS) regimen or distilled water (dH2O) as control. After first week of CDSS administration, mice were treated with FexD (50 mg/kg BW/d orally) for 4–5 weeks, with corn oil as vehicle control. (C) Expression of FXR target genes in the small intestine, measured by qRT-PCR. (DF) Expression of pro-inflammatory cytokines (D), M1-like macrophage cell marker genes (E), and M2-like macrophages marker genes (F) measured by qRT-PCR in small intestinal lamina propria cells from above treatment groups. (G and H) Representative flow cytometry analyses of the percentages of macrophages and monocytes and IL23+ and TNF-α+ macrophages (G) from small intestinal lamina propria cells. Data quantifications presented (H). n = 3–4/group. Experiments were independently replicated 3 times, and representative data are shown as the mean ± SEM. Wilcoxon test and 1-way ANOVA test followed by Tukey’s multiple comparisons are used; *CDSS versus dH2O, #FexD versus CDSS; *, #P < 0.05; **, ##P < 0.01; ***, ###P < 0.005.
Figure 5
Figure 5. FXR regulates BMDMs’ polarization and functional maturation.
(A) Experimental scheme of BMDM polarization and crosstalk to T cells. Polarization details are described in Methods. After polarization, BMDMs were treated with FXR agonists, FexD and OCA, or vehicle for 6 hours (step 1). Naive T cells were isolated from the spleen of WT mice and subjected to IL6 and TGF-β for initial Th17 cell in vitro differentiation for 24 hours. Then, the supernatant of BMDMs was added to Th17 cells for another 48 hours (step 2). Cell samples and cultured supernatant were harvested for qRT-PCR and ELISA. (B and C) Expression of M1 (B) and M2 (C) marker genes measured by qRT-PCR in polarized M1 or M2 BMDMs with above treatment. (D) Secreted (IL6, TNF-α) and intracellular (IL1β) cytokines were measured by ELISA in M1 BMDMs with above treatment. (E) Expression of cytokine genes measured by qRT-PCR in Th17 cells in vitro differentiated with M1 BMDM supernatant. (F) The level of cytokines secreted by Th17 cells was measured by ELISA. (G and H) Expression of M1 (G) and M2 (H) marker genes measured by qRT-PCR in polarized M1 or M2 FXR-deficient BMDMs. n = 3/group. Experiments were independently replicated 3 times, and representative data are shown as the mean ± SEM. P values are computed with 1-way ANOVA test followed by Tukey’s multiple comparisons. *M1/M2 versus M0 in WT or FXR-KO groups, #FexD and OCA versus DMSO in WT or FXR-KO groups; *, #P < 0.05; **, ##P < 0.01; ***, ###P < 0.005.
Figure 6
Figure 6. Gut macrophage–intrinsic FXR senses BA and regulates macrophage pro-inflammatory responses.
(A) Experimental scheme of gut macrophages enriched from small intestine of WT mice and subjected to various BAs for 6 hours. (B) Expression of pro-inflammatory cytokines and M1-like cell marker genes measured by qRT-PCR in gut macrophages treated with a gradient concentration of indicated BAs. (C) Experimental scheme of gut macrophages enriched from small intestine of WT and FXR-KO mice under 5 days of DSS administration and 2 days of recovery, then subjected to FXR agonist treatment for 18 hours. (D) Secreted (IL6, TNF-α) and intracellular (IL1β) cytokines were measured by ELISA in gut macrophages. (E and F) Expression of M1-like (E) and M2-like (F) marker genes by qRT-PCR in gut macrophages with above treatment. (G) Expression of M1-like marker genes by qRT-PCR in FXR-deficient (FXR-KO) gut macrophages. n = 3/group. Experiments were independently replicated 3 times, and representative data are shown as the mean ± SEM. P values are computed with 1-way ANOVA test followed by Tukey’s multiple comparisons; *M1/M2 versus M0 in WT or FXR-KO groups, *P < 0.05; **P < 0.01; ***P < 0.005.
Figure 7
Figure 7. FXR mediates macrophage-tailored intestinal immune responses and homeostasis.
(A) The scheme of FexD early intervention in WT mice under AOM/DSS regimen or dH2O as control. After second cycle of DSS, mice were treated with FexD (50 mg/kg BW/d orally) for 4–5 weeks, with corn oil as vehicle control. (BE) Representative flow cytometry analyses of small intestinal lamina propria cells: CD11bhiF4/80+, CD11bloF4/80+, and CD11b+F4/80+ total macrophages; IL23+ macrophages; and MHCIIhiCD206+, MHCIIloCD206+, CD11bhiCX3CR1hi, CD11bloCX3CR1lo, CD68loCD64+, and CD68hiCD64+ macrophages (B). Data quantification presented (CE). (F) Expression of M1-like and M2-like macrophage gene markers, measured by qRT-PCR. (G) Expression of macrophage surface markers like F4/80 (Adgre1 gene), antigen-presenting proteins such as MHCII (H2ab1 gene), IL23 receptor on CD4+ T cells (IL23r gene), and T cell recruitment chemokine genes (Cx3cl1, Cxcl2, and Cxcl16), measured by qRT-PCR. (H) Correlation between gene expression of FXR and gut macrophage markers (IL23a, IL1β, Cd11b, Csf1r, Cd64, Cd68) in an RNA-Seq database of sorted gut macrophages from B6 mice treated with 1.5% DSS with dH2O as a control. Rpkm, reads per kilobase million. n = 3–5/group. Experiments were independently replicated twice, and representative data are shown as the mean ± SEM. P values are computed with Student’s unpaired t test and 1-way ANOVA test followed by Tukey multiple comparisons. *DSS versus dH2O or drugs versus control, #FexD versus vehicle in AOM/DSS cohort; *, #P < 0.05; **, ##P < 0.01; ***, ###P < 0.005; ****P < 0.001.
Figure 8
Figure 8. FXR attenuates gut macrophages’ responses to inflammatory insults.
(A and B) Experimental scheme of WT (FXRwt_CX3CR1 group) and FXR conditional knockout in CX3CR1+ cells (FXRcKO_CX3CR1 group) mice challenged by CDSS (A). The deletion of FXR in CX3CR1+ cells was checked by FXR expression in enriched gut macrophages (B). (C and D) Representative live images of colon and quantification of colon weight and length and cecum weight in FXRwt_CX3CR1 group and FXRcKO_CX3CR1 group. (E and F) Representative live images of spleen and quantification of spleen weight (E) and pro-inflammatory cytokine levels of 2 million isolated splenic immune cells (F) in FXRwt_CX3CR1 and FXRcKO_CX3CR1 group. (G) Serum cytokines in FXRwt_CX3CR1 group and FXRcKO_CX3CR1 group. (H) Representative H&E staining, Alcian blue (AB)/periodic acid–Schiff (PAS) staining, and F4/80 staining of macrophages of small intestine in FXRwt_CX3CR1 and FXRcKO_CX3CR1 group. (Scale bar 100 or 200 μm.) (IL) Expression of general pro-inflammatory cytokine genes (IL6, TNFα, IL17A, etc.) and T cell marker genes (IL23r, Cx3cl1) (I), general macrophage marker genes (F4/80, Csfr1) (J), M1-like macrophage signature genes (Cd38, iNos, etc.) (K), and M2-like macrophage signature genes (Mgl2, Arg1, etc.) (L) in immune cells isolated from the lamina propria of the small intestine, measured by qRT-PCR. (M) Levels of pro-inflammatory cytokines in immune cells isolated from the lamina propria of the small intestine in FXRwt_CX3CR1 and FXRcKO_CX3CR1 group. (N) Representative flow cytometry analyses of small intestinal lamina propria cells: CD11bhiF4/80+, CD11bloF4/80+, and CD11b+F4/80+ total macrophages and MHCIIhiCD206+, MHCIIloCD206+, CD11bhiCX3CR1hi, CD11bloCX3CR1lo, CD68loCD64+, and CD68hiCD64+ macrophages. (OS) Data quantification of macrophages, subtypes of macrophages, and monocytes corresponding to above flow analysis. Experiments were independently replicated 2 times, and representative data are shown as the mean ± SEM. *FXRwt_CX3CR1 versus FXRcKO_CX3CR1. *P < 0.05; **P < 0.01; ***P < 0.005, Student’s t test (unpaired).

References

    1. Dekker E, et al. Colorectal cancer. Lancet. 2019;394(10207):1467–1480. doi: 10.1016/S0140-6736(19)32319-0. - DOI - PubMed
    1. Gadaleta RM, et al. Bile acids and colon cancer: is FXR the solution of the conundrum? Mol Aspects Med. 2017;56:66–74. doi: 10.1016/j.mam.2017.04.002. - DOI - PubMed
    1. Rhodes JM, Campbell BJ. Inflammation and colorectal cancer: IBD-associated and sporadic cancer compared. Trends Mol Med. 2002;8(1):10–16. doi: 10.1016/S1471-4914(01)02194-3. - DOI - PubMed
    1. Terzic J, et al. Inflammation and colon cancer. Gastroenterology. 2010;138(6):2101–2114. doi: 10.1053/j.gastro.2010.01.058. - DOI - PubMed
    1. Chevre R, et al. Nutritional modulation of innate immunity: the fat-bile-gut connection. Trends Endocrinol Metab. 2018;29(10):686–698. doi: 10.1016/j.tem.2018.08.002. - DOI - PubMed

Publication types

Substances