. 2024 Feb 21;90(2):e0202523.
doi: 10.1128/aem.02025-23. Epub 2024 Jan 23.

Metagenomic insights into the dynamic degradation of brown algal polysaccharides by kelp-associated microbiota

Affiliations

Metagenomic insights into the dynamic degradation of brown algal polysaccharides by kelp-associated microbiota

Yi-Shuo Zhang et al. Appl Environ Microbiol. .

Abstract

Marine bacteria play important roles in the degradation and cycling of algal polysaccharides. However, the dynamics of epiphytic bacterial communities and their roles in algal polysaccharide degradation during kelp decay are still unclear. Here, we performed metagenomic analyses to investigate the identities and predicted metabolic abilities of epiphytic bacterial communities during the early and late decay stages of the kelp Saccharina japonica. During kelp decay, the dominant epiphytic bacterial communities shifted from Gammaproteobacteria to Verrucomicrobia and Bacteroidetes. In the early decay stage of S. japonica, epiphytic bacteria primarily targeted kelp-derived labile alginate for degradation, among which the gammaproteobacterial Vibrionaceae (particularly Vibrio) and Psychromonadaceae (particularly Psychromonas), abundant in alginate lyases belonging to the polysaccharide lyase (PL) families PL6, PL7, and PL17, were key alginate degraders. More complex fucoidan was preferred to be degraded in the late decay stage of S. japonica by epiphytic bacteria, predominantly from Verrucomicrobia (particularly Lentimonas), Pirellulaceae of Planctomycetes (particularly Rhodopirellula), Pontiellaceae of Kiritimatiellota, and Flavobacteriaceae of Bacteroidetes, which depended on using glycoside hydrolases (GHs) from the GH29, GH95, and GH141 families and sulfatases from the S1_15, S1_16, S1_17, and S1_25 families to depolymerize fucoidan. The pathways for algal polysaccharide degradation in dominant epiphytic bacterial groups were reconstructed based on analyses of metagenome-assembled genomes. This study sheds light on the roles of different epiphytic bacteria in the degradation of brown algal polysaccharides.IMPORTANCEKelps are important primary producers in coastal marine ecosystems. Polysaccharides, as major components of brown algal biomass, constitute a large fraction of organic carbon in the ocean. However, knowledge of the identities and pathways of epiphytic bacteria involved in the degradation process of brown algal polysaccharides during kelp decay is still elusive. Here, based on metagenomic analyses, the succession of epiphytic bacterial communities and their metabolic potential were investigated during the early and late decay stages of Saccharina japonica. Our study revealed a transition in algal polysaccharide-degrading bacteria during kelp decay, shifting from alginate-degrading Gammaproteobacteria to fucoidan-degrading Verrucomicrobia, Planctomycetes, Kiritimatiellota, and Bacteroidetes. A model for the dynamic degradation of algal cell wall polysaccharides, a complex organic carbon, by epiphytic microbiota during kelp decay was proposed. This study deepens our understanding of the role of epiphytic bacteria in marine algal carbon cycling as well as pathogen control in algal culture.

Keywords: alginate; epiphytic bacteria; fucoidan; host–microbe interaction; kelp; metagenomics; polysaccharide degradation.


Conflict of interest statement

The authors declare no conflict of interest.

Figures

Fig 1
Fig 1
The relative abundance of bacterial taxa associated with S. japonica in the early (a) and late (b) decay stages. “Other bacteria” represents bacterial groups with relative abundance lower than 1% at the class level.
Fig 2
Fig 2
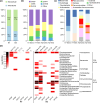
Shift in alginate-degrading epiphytic bacteria and their alginate lyase genes during kelp decay. (a) Changes in the relative abundance of predicted extracellular and intracellular alginate lyase genes. Relative abundance and number (in parentheses) of related alginate lyase genes were shown for each sample. (b) Changes in the families of predicted extracellular and intracellular alginate lyase genes. (c) Changes in the bacterial groups containing predicted extracellular or intracellular alginate lyase genes at the class level. In (b) and (c), “X1-Extra” and “X1-Intra” represent predicted extracellular or intracellular alginate lyase genes from early decaying kelp-associated bacteria, respectively, and “X2-Extra” and “X2-Intra” represent predicted extracellular or intracellular alginate lyase genes from late decaying kelp-associated bacteria, respectively. (d) Heatmap showing detailed changes in the relative abundance (log2) of predicted extracellular alginate lyase genes and their related bacterial groups. The colors in the heatmap indicate relative gene abundance, ranging from high (black) to low (white) abundance. Relative abundance and number (in parentheses) of alginate lyase genes from each family were shown on top of the heatmap.
Fig 3
Fig 3
Shift in fucoidan-degrading epiphytic bacteria and their fucoidanase genes during kelp decay. (a) Changes in the relative abundance of predicted extracellular and intracellular fucoidanase genes. Relative abundance and number (in parentheses) of related fucoidanase genes were shown for each sample. (b) Changes in the families of predicted extracellular and intracellular fucoidanase genes. (c) Changes in the bacterial groups containing predicted extracellular or intracellular fucoidanase genes at the class level. In (b) and (c), “X1-Extra” and “X1-Intra” represent predicted extracellular or intracellular fucoidanase genes from early decaying kelp-associated bacteria, respectively, and “X2-Extra” and “X2-Intra” represent predicted extracellular or intracellular fucoidanase genes from late decaying kelp-associated bacteria, respectively. (d) Heatmap showing detailed changes in the relative abundance (log2) of predicted extracellular fucoidanase genes and their related bacterial groups. The colors in the heatmap indicate relative gene abundance, ranging from high (black) to low (white) abundance. Relative abundance and number (in parentheses) of fucoidanase genes from each family were shown on top of the heatmap.
Fig 4
Fig 4
Changes in sulfatase-producing epiphytic bacteria and their sulfatase genes during kelp decay. (a) Changes in the relative abundance of predicted extracellular and intracellular sulfatase genes. Relative abundance and number (in parentheses) of related sulfatase genes were shown for each sample. (b) Changes in the families of predicted extracellular and intracellular sulfatase genes. (c) Changes in the bacterial groups containing predicted extracellular or intracellular sulfatase genes at the class level. In (b) and (c), “X1-Extra” and “X1-Intra” represent predicted extracellular or intracellular sulfatase genes from early decaying kelp-associated bacteria, respectively, and “X2-Extra” and “X2-Intra” represent predicted extracellular or intracellular sulfatase genes from late decaying kelp-associated bacteria, respectively. (d) Heatmap showing detailed changes in the relative abundance (log2) of predicted extracellular sulfatase genes and their related bacterial groups. The colors in the heatmap indicate relative gene abundance, ranging from high (black) to low (white) abundance. Relative abundance and number (in parentheses) of sulfatase genes from each family were shown on top of the heatmap.
Fig 5
Fig 5
Shift in laminarin-degrading epiphytic bacteria and their laminarin-degrading genes during kelp decay. (a) Changes in the relative abundance of predicted extracellular and intracellular laminarin-degrading genes. Relative abundance and number (in parentheses) of related laminarin-degrading genes were shown for each sample. (b) Changes in the families of predicted extracellular and intracellular laminarin-degrading genes. (c) Changes in the bacterial groups containing predicted extracellular or intracellular laminarin-degrading genes at the class level. In (b) and (c), “X1-Extra” and “X1-Intra” represent predicted extracellular or intracellular laminarin-degrading genes from early decaying kelp-associated bacteria, respectively, and “X2-Extra” and “X2-Intra” represent predicted extracellular or intracellular laminarin-degrading genes from late decaying kelp-associated bacteria, respectively. (d) Heatmap showing detailed changes in the relative abundance (log2) of predicted extracellular laminarin-degrading genes and their related bacterial groups. The colors in the heatmap indicate relative gene abundance, ranging from high (black) to low (white) abundance. Relative abundance and number (in parentheses) of laminarin-degrading genes from each family were shown on top of the heatmap.
Fig 6
Fig 6
Heatmap showing the number of homologs of putative brown algal polysaccharide-degrading enzymes in MAGs.
Fig 7
Fig 7
Key alginate-degrading (a) and fucoidan-degrading (b) genes in epiphytic MAGs. open reading frames (ORFs) were depicted using different colored arrows based on their functional annotations. Putative alginate lyases, GHs, and sulfatases were indicated according to dbCAN and Pfam analyses. MFS, major facility superfamily; TRAP, tripartite ATP-independent periplasmic; ABC, ATP-binding cassette.
Fig 8
Fig 8
Predicted degradation pathways for brown algal polysaccharides in representative epiphytic MAGs. (a) X1_bin53 (Shewanellaceae). (b) X1_bin16 (Enterobacteriaceae). (c) X2_bin3 (Puniceicoccaceae). (d) X2_bin21 (Pontiellaceae). (e) X1_bin9 (Flavobacteriaceae). (f) X2_bin33 (Flavobacteriaceae). Enzymes involved in alginate, fucoidan, and laminarin utilization are colored in red, green, and blue, respectively. Symbols for transporters involved in alginate, fucoidan, and laminarin utilization are shown in red, green, and blue, respectively. Solid arrows denote enzymatic reactions, and dotted arrows denote transport. The unknown transporters are indicated by a question mark (?). The cellular location of enzymes/transporters is predicted according to PSORTb v3.0 (57) and CELLO v.2.5 (58) combined with SignalP 5.0 (59), and enzymes without predictable cellular locations are not shown. DEH, 4-deoxy-L-erythro-5-hexoseulose uronic acid; KDG, 2-keto-3-deoxy-D-gluconate; KDPG, 2-keto-3-deoxy-6-phosphogluconate.
Fig 9
Fig 9
A proposed model for the degradation of brown algal polysaccharides by epiphytic microbiota during kelp decay. Symbols representing alginate-degrading bacterial groups associated with early decaying Saccharina japonica are scaled to the relative abundance (in parentheses) of corresponding bacterial groups harboring predicted extracellular alginate lyases. Sizes of symbols for fucoidan-degrading bacterial groups associated with late decaying S. japonica are proportional to the relative abundance (colored in black in parentheses) of corresponding bacterial groups containing predicted extracellular fucoidanases. For fucoidan-degrading bacterial groups, the relative abundance (colored in green in parentheses) of individual bacterial groups harboring predicted extracellular sulfatases is also shown. The distribution of extracellular algal polysaccharide-degrading enzymes in early and late decay stages is illustrated in Euler diagrams, wherein sizes of the enzyme symbols are scaled based on the relative abundances of corresponding enzyme genes in each sample and overlapping regions represent enzymes shared by certain epiphytic bacteria.

References

    1. Wiencke C, Amsler CD. 2012. Seaweeds and their communities in polar regions, p 265–291. In Wiencke C, Bischof K (ed), Seaweed biology: novel insights into ecophysiology, ecology and utilization. Vol. 219. Springer, Berlin, Germany.
    1. Wang M, Hu C, Barnes BB, Mitchum G, Lapointe B, Montoya JP. 2019. The great Atlantic Sargassum belt. Science 365:83–87. doi:10.1126/science.aaw7912 - DOI - PubMed
    1. Krause-Jensen D, Duarte CM. 2016. Substantial role of macroalgae in marine carbon sequestration. Nature Geosci 9:737–742. doi:10.1038/ngeo2790 - DOI
    1. Azam F, Malfatti F. 2007. Microbial structuring of marine ecosystems. Nat Rev Microbiol 5:782–791. doi:10.1038/nrmicro1747 - DOI - PubMed
    1. Hardison AK, Canuel EA, Anderson IC, Veuger B. 2010. Fate of macroalgae in benthic systems: carbon and nitrogen cycling within the microbial community. Mar Ecol Prog Ser 414:41–55. doi:10.3354/meps08720 - DOI

Publication types

Supplementary concepts

LinkOut - more resources