. 2024 Feb 20;9(2):e0088723.
doi: 10.1128/msystems.00887-23. Epub 2024 Jan 23.

Disturbance-diversity relationships of microbial communities change based on growth substrate

Affiliations

Disturbance-diversity relationships of microbial communities change based on growth substrate

Don Q Hoang et al. mSystems. .

Abstract

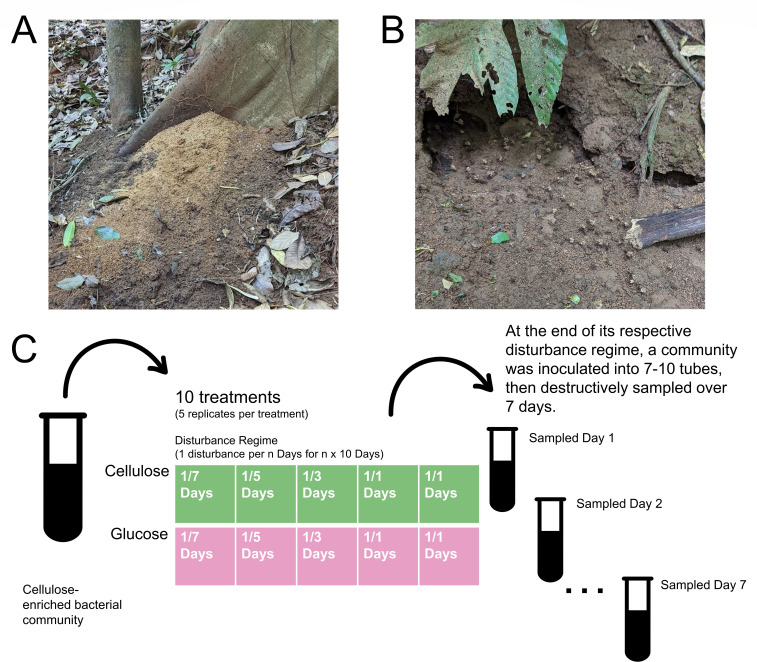
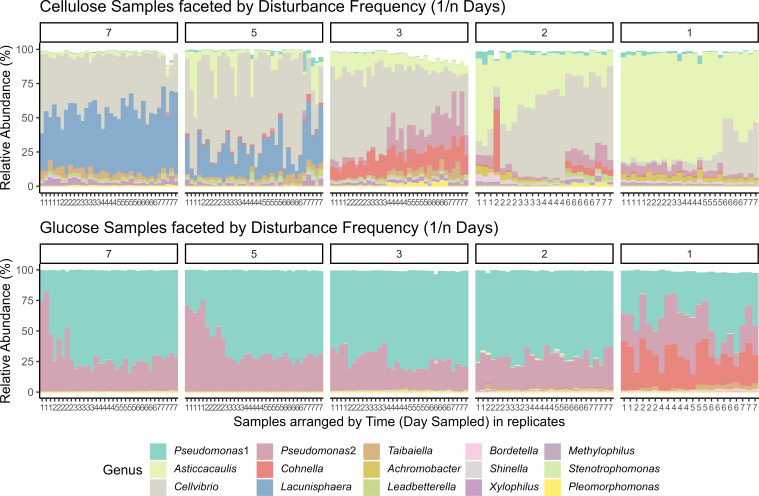
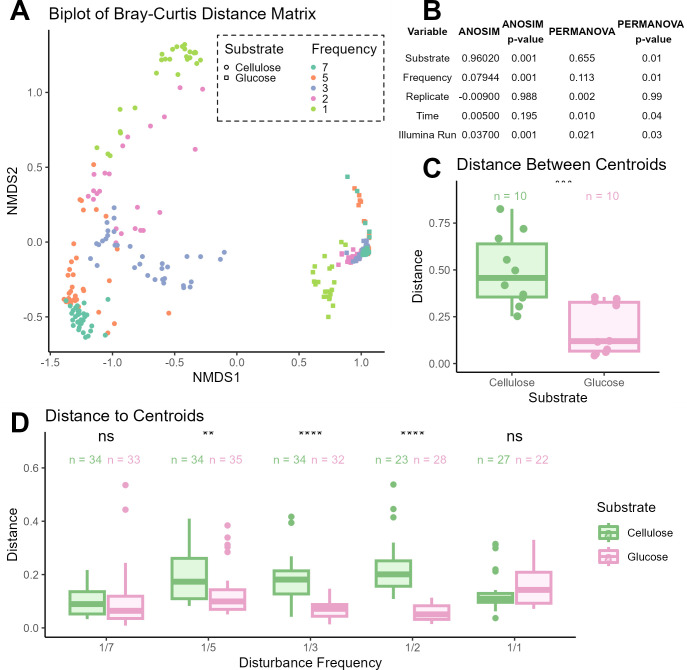
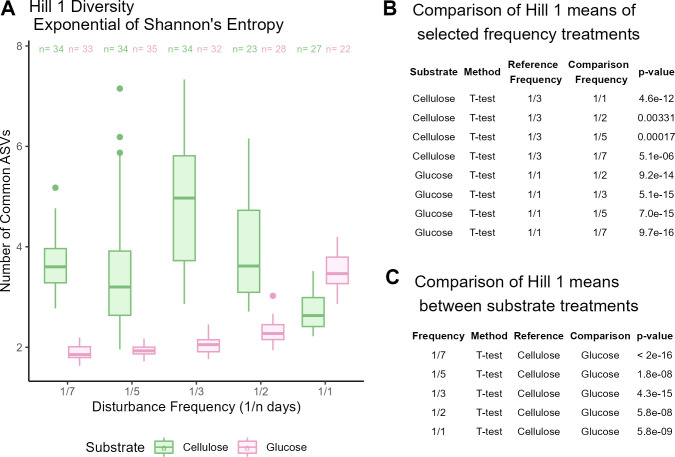
Disturbance events can impact ecological community dynamics. Understanding how communities respond to disturbances and how those responses can vary is a challenge in microbial ecology. In this study, we grew a previously enriched specialized microbial community on either cellulose or glucose as a sole carbon source and subjected them to one of five different disturbance regimes of varying frequencies ranging from low to high. Using 16S rRNA gene amplicon sequencing, we show that the community structure is largely driven by substrate, but disturbance frequency affects community composition and successional dynamics. When grown on cellulose, bacteria in the genera Cellvibrio, Lacunisphaera, and Asticcacaulis are the most abundant microbes. However, Lacunisphaera is only abundant in the lower disturbance frequency treatments, while Asticcacaulis is more abundant in the highest disturbance frequency treatment. When grown on glucose, the most abundant microbes are two Pseudomonas sequence variants and a Cohnella sequence variant that is only abundant in the highest disturbance frequency treatment. Communities grown on cellulose exhibited a greater range of diversity (1.95-7.33 Hill 1 diversity) that peaks at the intermediate disturbance frequency treatment or one disturbance every 3 days. Communities grown on glucose, however, ranged from 1.63 to 5.19 Hill 1 diversity with peak diversity at the greatest disturbance frequency treatment. These results demonstrate that the dynamics of a microbial community can vary depending on substrate and the disturbance frequency and may potentially explain the variety of diversity-disturbance relationships observed in microbial systems.IMPORTANCEA generalizable diversity-disturbance relationship (DDR) of microbial communities remains a contentious topic. Various microbial systems have different DDRs. Rather than finding support or refuting specific DDRs, we investigated the underlying factors that lead to different DDRs. In this study, we measured a cellulose-enriched microbial community's response to a range of disturbance frequencies from high to low, across two different substrates: cellulose and glucose. We demonstrate that the community displays a unimodal DDR when grown on cellulose and a monotonically increasing DDR when grown on glucose. Our findings suggest that the same community can display different DDRs. These results suggest that the range of DDRs we observe across different microbial systems may be due to the nutritional resources microbial communities can access and the interactions between bacteria and their environment.

Keywords: cellulose; disturbance; leaf-cutter ant; microbial communities; microbial ecology.


Conflict of interest statement

The authors declare no conflict of interest.

Figures

Fig 1
Fig 1
(A) Image of A. colombica refuse dump. These piles are predominantly composed of partially degraded plant biomass, removed from the bottom of fungus gardens by worker ants. (B) Worker ants carrying pieces of refuse material. (C) Experimental setup. The cellulose-enriched community was used as the starter inoculum for the growth of microbial communities exposed to 10 treatments. Samples were grown in either cellulose- or glucose-supplemented M63 minimal media, then subjected to one of five disturbance regimes. At the end of their respective disturbance regime, communities were used to inoculate 7–10 tubes (containing their respective substrate), and those tubes were destructively sampled every day for 7 days. “Test tube” icon by art shop and “arrow” icon by Yoteyo, from thenounproject.com CC BY 3.0.
Fig 2
Fig 2
Bar graph of community composition based on relative abundance of 16S rRNA gene amplicon sequencing of the top 15 most abundant ASVs and their assigned bacterial genus. The top row of plots represents samples grown in M63 minimal media and cellulose, and the bottom row of plots represents samples grown in M63 minimal media and glucose. Plots are faceted by disturbance frequency (1/n days). Within each facet, samples are grouped by time sampled to observe any compositional dynamics.
Fig 3
Fig 3
(A) NMDS plot of community composition. The distance matrix was calculated using the Bray–Curtis distance method. We examined the first three dimensions in ordination analysis (k = 3, stress = 0.037) but visualize a biplot for ease. A 3D view can be found in Fig. S3. Communities grown in cellulose are shown as circles, and communities grown in glucose are shown as squares. Disturbance frequency is marked by color. (B) Table of ANOSIM and PERMANOVA calculations of recorded factors that may contribute to variance. (C) Boxplot of distances between centroids of data clusters based on disturbance frequency and accounting for substrate treatment (cellulose in green, glucose in pink). The significance label represents Student’s t-test, comparing the mean distance between cellulose and glucose treatments. (D) Boxplot of distance to centroids of samples, clustered based on disturbance frequency and accounting for substrate. Significance labels represent Student’s t-test, comparing the mean distance between cellulose and glucose treatments of the same disturbance frequency. The mean distance between disturbance frequency treatments for cellulose samples (ANOVA P-value = 2.0e−07) and glucose samples (ANOVA P-value = 1.9e−05) was statistically significant.
Fig 4
Fig 4
(A) Boxplot of Hill 1 diversity. Green boxes represent samples grown on cellulose, pink boxes represent samples grown on glucose, and “n” refers to the number of samples within that disturbance frequency treatment. (B) Table of Student’s t-tests demonstrating that the 1/3 days disturbance frequency for cellulose has the highest mean Hill 1 diversity compared to other cellulose samples and that the 1/1 day disturbance frequency for glucose has the highest mean Hill 1 diversity compared to other glucose samples. (C) Table of Student’s t-tests comparing means of Hill 1 diversity measurements between cellulose and glucose samples of different disturbance frequency treatments.

Update of

Similar articles

Cited by

References

    1. Plante CJ. 2017. Defining disturbance for microbial ecology. Microb Ecol 74:259–263. doi:10.1007/s00248-017-0956-4 - DOI - PubMed
    1. Sousa WP. 1984. The role of disturbance in natural communities. Annu Rev Ecol Syst 15:353–391. doi:10.1146/annurev.es.15.110184.002033 - DOI
    1. Rykiel EJ. 1985. Towards a definition of ecological disturbance. Austral Ecol 10:361–365. doi:10.1111/j.1442-9993.1985.tb00897.x - DOI
    1. Shade A, Peter H, Allison SD, Baho DL, Berga M, Bürgmann H, Huber DH, Langenheder S, Lennon JT, Martiny JBH, Matulich KL, Schmidt TM, Handelsman J. 2012. Fundamentals of microbial community resistance and resilience. Front Microbiol 3:417. doi:10.3389/fmicb.2012.00417 - DOI - PMC - PubMed
    1. Connell JH. 1978. Diversity in tropical rain forests and coral ReefsNew series. Science 199:1302–1310. doi:10.1126/science.199.4335.1302 - DOI - PubMed

LinkOut - more resources