. 2024 Jan 8:17:1242720.
doi: 10.3389/fnhum.2023.1242720. eCollection 2023.

Frequency effects in linear discriminative learning

Affiliations

Frequency effects in linear discriminative learning

Maria Heitmeier et al. Front Hum Neurosci. .

Abstract

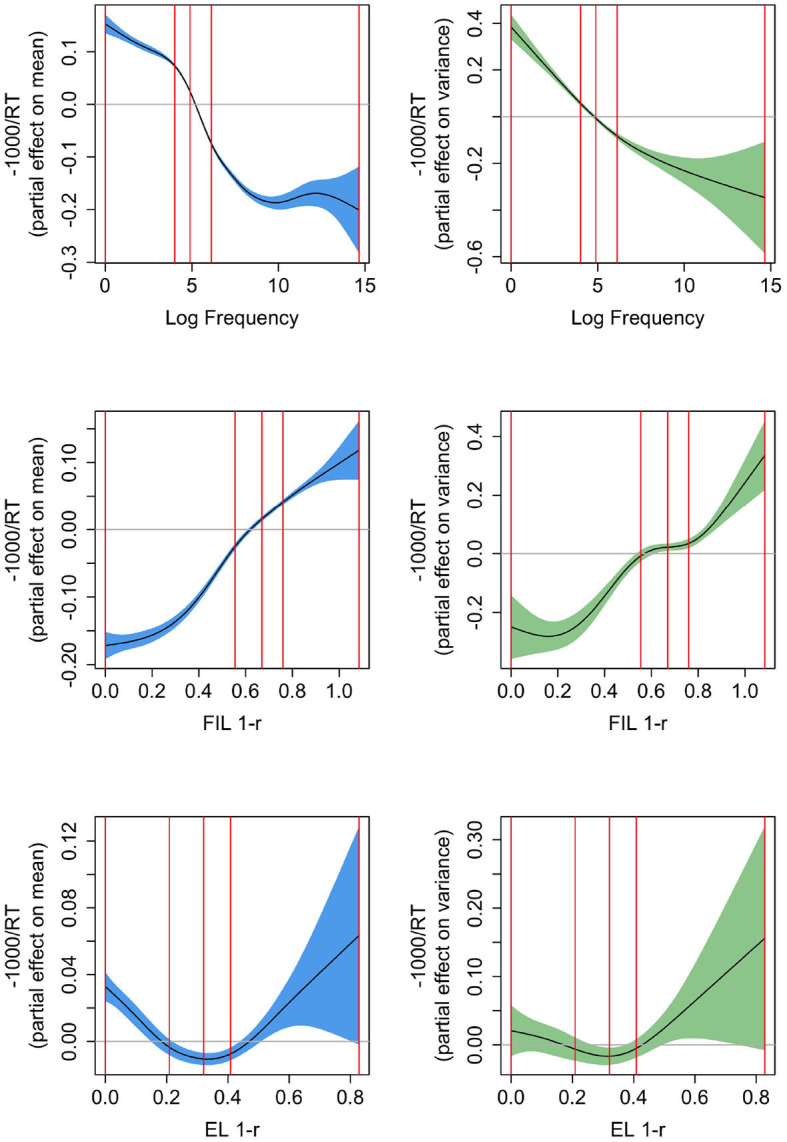
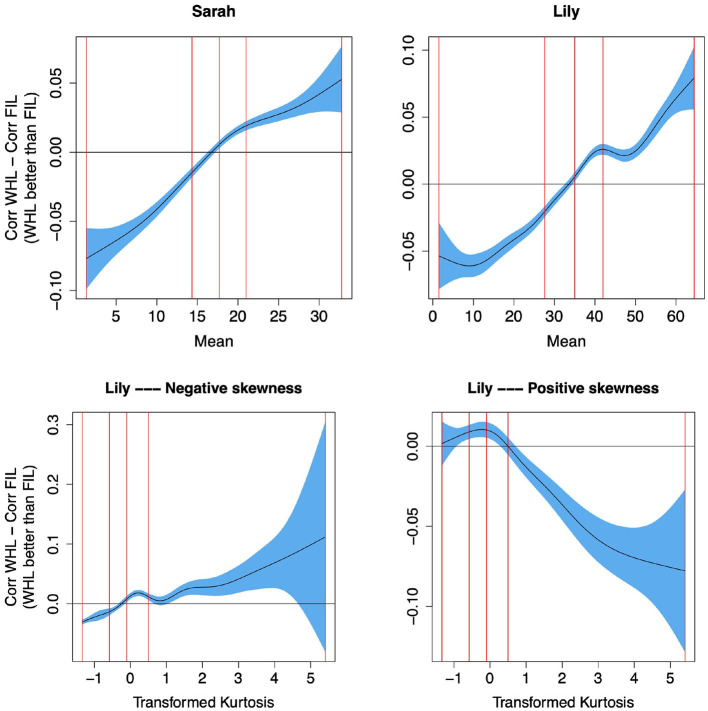
Word frequency is a strong predictor in most lexical processing tasks. Thus, any model of word recognition needs to account for how word frequency effects arise. The Discriminative Lexicon Model (DLM) models lexical processing with mappings between words' forms and their meanings. Comprehension and production are modeled via linear mappings between the two domains. So far, the mappings within the model can either be obtained incrementally via error-driven learning, a computationally expensive process able to capture frequency effects, or in an efficient, but frequency-agnostic solution modeling the theoretical endstate of learning (EL) where all words are learned optimally. In the present study we show how an efficient, yet frequency-informed mapping between form and meaning can be obtained (Frequency-informed learning; FIL). We find that FIL well approximates an incremental solution while being computationally much cheaper. FIL shows a relatively low type- and high token-accuracy, demonstrating that the model is able to process most word tokens encountered by speakers in daily life correctly. We use FIL to model reaction times in the Dutch Lexicon Project by means of a Gaussian Location Scale Model and find that FIL predicts well the S-shaped relationship between frequency and the mean of reaction times but underestimates the variance of reaction times for low frequency words. FIL is also better able to account for priming effects in an auditory lexical decision task in Mandarin Chinese, compared to EL. Finally, we used ordered data from CHILDES to compare mappings obtained with FIL and incremental learning. We show that the mappings are highly correlated, but that with FIL some nuances based on word ordering effects are lost. Our results show how frequency effects in a learning model can be simulated efficiently, and raise questions about how to best account for low-frequency words in cognitive models.

Keywords: distributional semantics; incremental learning; lexical decision; linear discriminative learning; mental lexicon; weighted regression; word frequency.


Conflict of interest statement

The authors declare that the research was conducted in the absence of any commercial or financial relationships that could be construed as a potential conflict of interest.

Figures

Figure 1
Figure 1
Endstate learning. The green filled dots on the horizontal lines at 0 and 1 represent the correlation accuracies@1 for the individual words (counted as correct if the semantic vector most correlated with the predicted semantic vector is the target), and the light pink circles represent the correlation values of words' predicted semantic vectors with their target vectors. The dark blue dotted line presents the estimated kernel density for log frequency. There is no discernible relationship between Log Frequency and correlation/accuracy for endstate learning.
Figure 2
Figure 2
Relationship between accuracy and frequency for incremental learning. Left: Mapping trained using full frequencies. Predicted accuracy is depicted for three different learning rates [η ∈ {0.01, 0.001, 0.0001}], and the light pink circles present target correlations for η = 0.01. Center: Mapping trained using log-transformed frequencies. Right: Mapping trained using frequencies divided by a factor of 100. While there is a strong relationship between log frequency and accuracy/correlation when training on full frequencies and scaled frequencies, this relationship is attenuated when training on log-transformed frequencies.
Figure 3
Figure 3
Frequency-informed learning. The red solid line presents the predictions of a GLM when a success is defined as the predicted vector being the closest to its gold standard target vector in terms of correlation (accuracy@1). The light blue dashed line represents predictions of a GLM when a success is defined as the correlation being among the top 10 (accuracy@10). The dark blue dotted line visualizes the estimated density of the log-transformed frequencies. The green filled dots represent the successes and failures for accuracy@1. The light pink circles represent for each word the correlation of the predicted and gold-standard semantic vectors. There is a strong relationship between log frequency and correlation/accuracy, and the GLM-predicted accuracy@10 is shifted to the left, i.e., accuracy@10 rises for lower frequencies.
Figure 4
Figure 4
Accuracy@1 as a function of log frequency, using frequency-informed learning with log-transformed frequencies. When FIL is trained with log-transformed frequencies, lower-frequency words are recognized more accurately, but higher-frequency words less accurately.
Figure 5
Figure 5
Comparison of methods. GLM-predicted Accuracy@1 with frequency-informed learning is plotted as a black line: The left panel compares methods based on log-frequencies, the center panel compares methods based on scaled frequencies and the right panel compares incremental learning with different learning rates. Incremental learning with scaled frequencies or with a very low learning rate (η = 0.0001) is closest to frequency-informed learning.
Figure 6
Figure 6
Predicted accuracy@1 as a function of log frequency for high-dimensional representations of form and meaning (red solid line). The light blue dashed line shows the predicted accuracy based on the low-dimensional model, for comparison. The light pink circles represent the target correlations in the high-dimensional model. The small dataset refers to the dataset with 2,638 word forms based on Ernestus and Baayen (2003), the large dataset to the dataset created from the DLP (Brysbaert and New, 2009) including 13,669 word forms. For the small and large datasets, a clear relationship between log frequency and correlation/accuracy is visible.
Figure 7
Figure 7
Partial effects for mean (left, confidence intervals in blue) and variance [right, confidence intervals in green, the y-axis is on the log(σ−0.01) scale], for Gaussian Location-Scale GAMs predicting reaction times from log frequency (upper panels), from 1 − r based on FIL (center panels), and from 1 − r based on EL (bottom panels). The vertical red lines represent the 0, 25, 50, 75, and 100% percentiles. FIL 1-r is a solid predictor for mean and variance in RTs.
Figure 8
Figure 8
Partial effects for mean (left, confidence intervals in blue) and variance [center and right, confidence intervals in green, the y-axis is on the log(σ−0.01) scale], for Gaussian Location-Scale GAMs predicting 1 − r from log frequency for FIL (upper panels), and for EL (bottom panels). The panel in the upper right zooms in on the partial effect of variance shown to its left. The vertical red lines represent the quartiles of log frequency. FIL 1-r shows a similar S-shaped curve as a function of frequency as observed for reaction times, but does not have a similar effect as frequency on the variance in the reaction times.
Figure 9
Figure 9
Boxplots of LDL simulated RTs for the four priming conditions in Lee (2007) with EL (left) and FIL (right). FIL correctly predicts the experimental results of Lee (2007).
Figure 10
Figure 10
Correlation of WHL learned predicted semantics with their targets against correlations of FIL learned predicted semantics with their targets (blue dots), for different learning rates, and for Sarah (A) and Lily (B). The diagonal red lines denote the x = y line. WHL target correlations and FIL target correlations are highly correlated, with the tightest relationship visible for η = 0.01 for Sarah and η = 0.001 for Lily (see also Table 3).
Figure 11
Figure 11
Individual tokens where FIL and WHL correlations to target differ clearly, taken from “Sarah”, trained with WHL and η = 0.01. (A) Shows cases where FIL outperforms WHL, (B) where WHL outperforms FIL. Frequencies are normalized by their maximal frequency inside a learning batch of 5,000 learning events. In (A), frequency tends to decrease over time. Thus, the item is learned well in the beginning, and the correlation with target goes down over time. In (B) the opposite is the case.
Figure 12
Figure 12
Predicting the difference between target correlations in WHL and in FIL from frequency distribution of words across time. The y-axes show partial effects. Top row: The higher the mean (i.e., higher frequencies at later time steps, see “giraffe” and “alligator” in the lower row of Figure 11 for examples of words with a high mean), the better WHL performs than FIL. The vertical red lines represent the 0, 25, 50, 75, and 100% percentiles. Bottom row: For negative skew (higher frequencies at later time steps), the peakier the distribution (higher kurtosis), the larger the advantage of WHL over FIL, and vice versa for positive skew. Kurtosis was transformed to reduce outlier effects, details in Supplementary material. WHL outperforms FIL for words with higher frequencies at later learning steps.

References

    1. Adelman J. S., Brown G. D. (2008). Modeling lexical decision: the form of frequency and diversity effects. Psychol. Rev. 115, 214. 10.1037/0033-295X.115.1.214 - DOI - PubMed
    1. Baayen R. H. (2001). Word Frequency Distributions. Dordrecht: Kluwer Academic Publishers.
    1. Baayen R. H. (2005). “Data mining at the intersection of psychology and linguistics,” in Twenty-First Century Psycholinguistics: Four Cornerstones, ed Cutler A. (Hillsdale, NJ: Erlbaum; ), 69–83.
    1. Baayen R. H. (2010). Demythologizing the word frequency effect: a discriminative learning perspective. Ment. Lex. 5, 436–461. 10.1075/ml.5.3.10baa - DOI
    1. Baayen R. H., Chuang Y.-Y., Heitmeier M. (2018b). WpmWithLdl: Implementation of Word and Paradigm Morphology With Linear Discriminative Learning. R package Version 1.2.20.

LinkOut - more resources