

Association between sociodemographic status and the T2DM-related risks in China: implication for reducing T2DM disease burden
- PMID: 38259760
- PMCID: PMC10801005
- DOI: 10.3389/fpubh.2023.1297203
Association between sociodemographic status and the T2DM-related risks in China: implication for reducing T2DM disease burden
Abstract
Objective: Analyzing the association between sociodemographic status and the type 2 diabetes mellitus (T2DM)-related risks in China to reduce the disease burden of T2DM.
Methods: We downloaded data from the Global Burden of Disease Study 2019 to estimate the disease burden of T2DM in China. Secondary analyses were performed by year, age, gender, summary exposure value (SEV), and sociodemographic index (SDI).
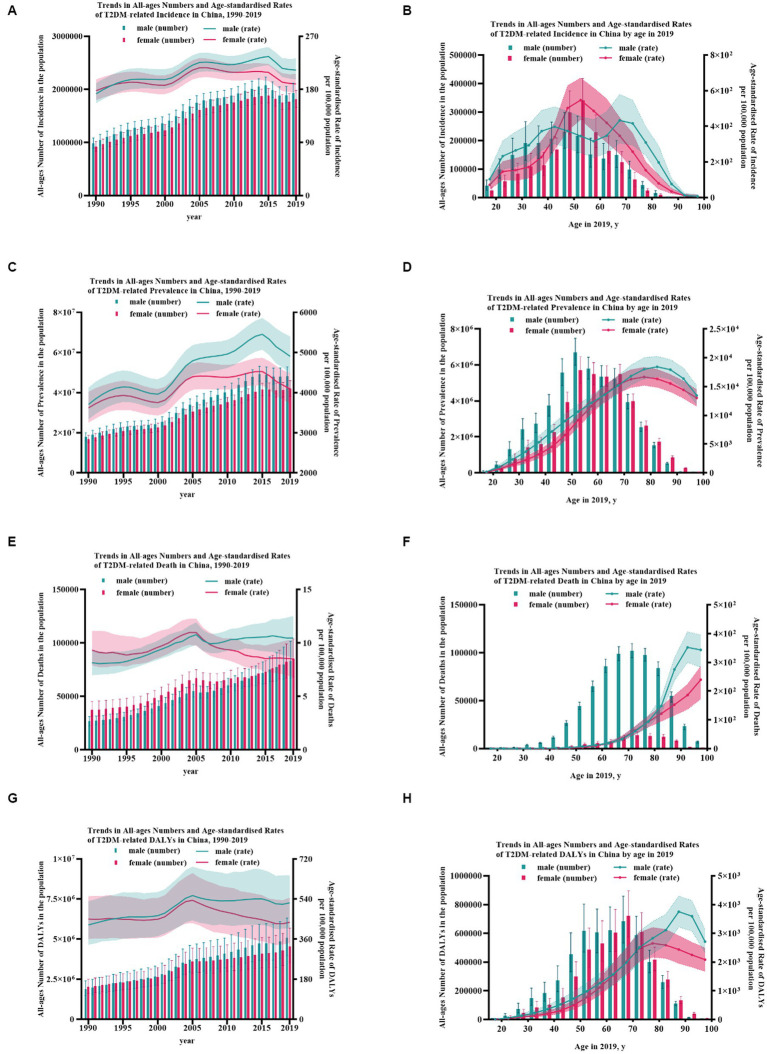
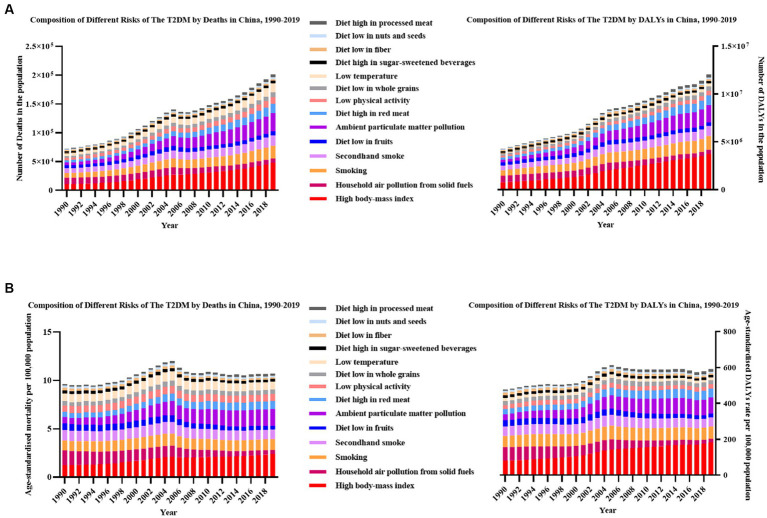
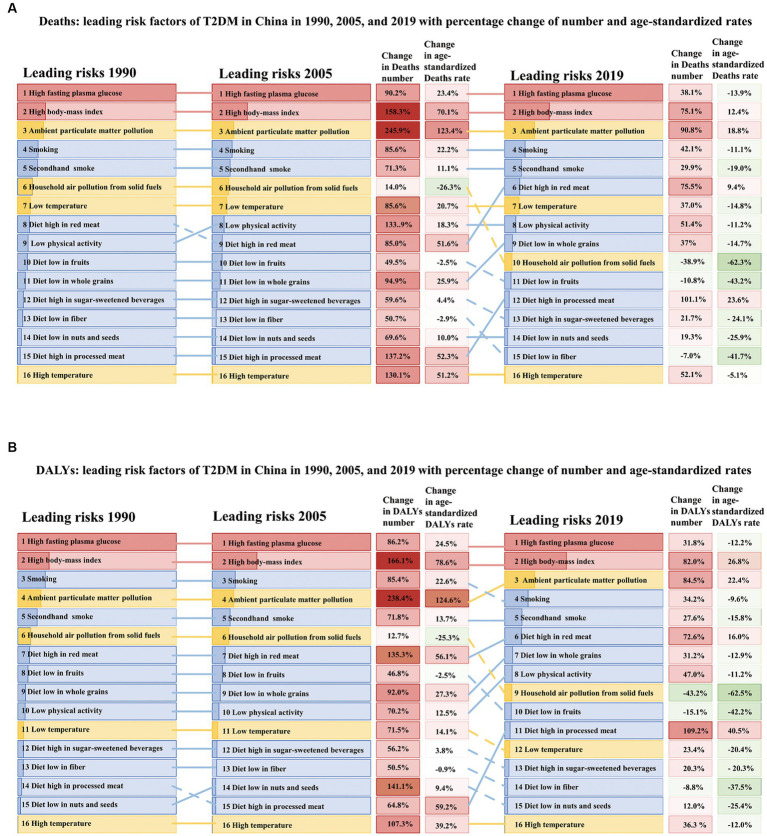
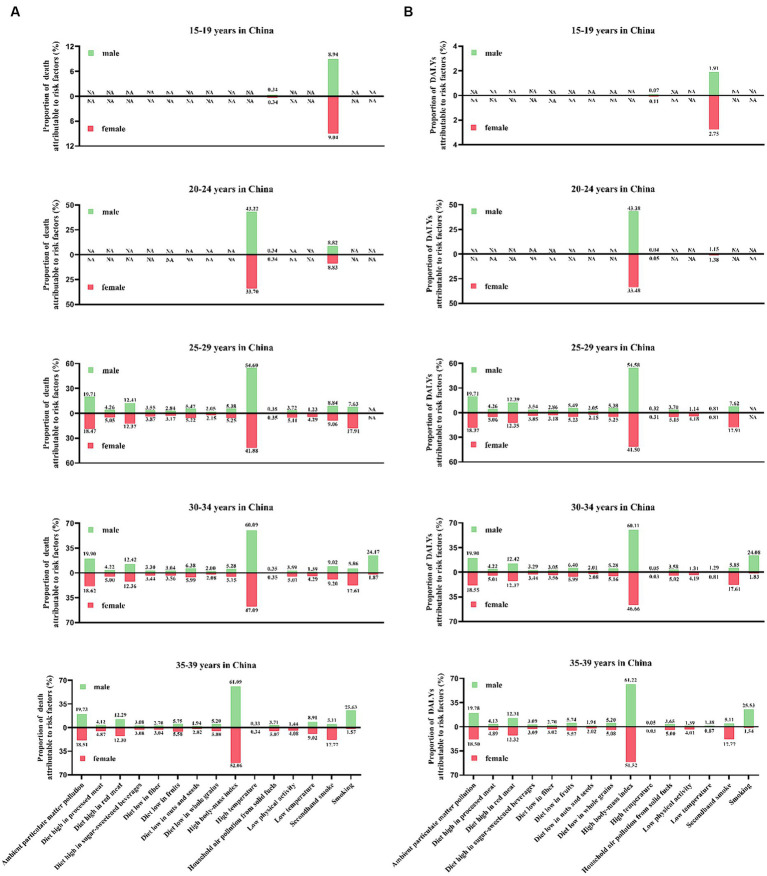
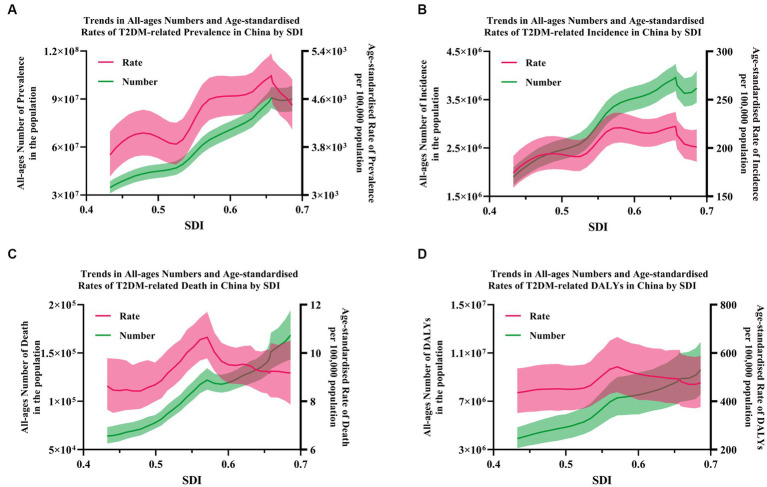
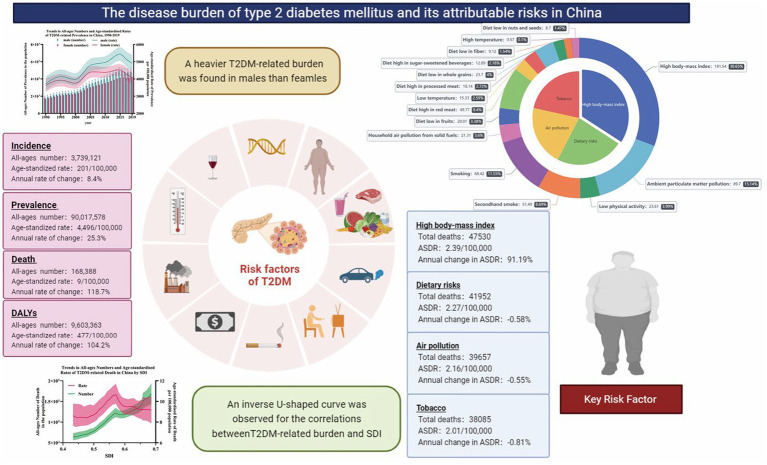
Results: In China, it is estimated that 3.74 (3.44-4.10) million incidence, 90.0 (82.3-98.5) million prevalence, 168.4 (143.2-194.0) thousand deaths, and 9.6 (7.6-11.9) million DALYs occurred in 2019, showing an increase of 96.8, 156.7, 162.8, and 145.4% compared to 1990. An inverse U-shaped curve was observed for the correlations between T2DM-related burden and SDI. A heavier burden was found in males. The top four risk factors were high body mass index (HBMI), dietary risks, air pollution and tobacco. HBMI, as the key risk, accounted for half of the disease burden of T2DM in China. Lower degree of SEV and higher level of attributable T2DM-related burden could be found in main risks, meaning their critical role of them in the development and progression of T2DM. An inverse U-shaped curve could be found in the association between age-standardized incidence, mortality, DALYs rate, and SDI.
Conclusion: The disease burden of T2DM has rapidly increased in China. Gender disparities, different age distributions and inconsistent socioeconomic levels all played an important role in it. The key risk was HBMI. With the improvement of socioeconomic level, the main risk factors for T2DM have changed from environmental factors to lifestyle factors. Targeted control and preventative strategies to address adjustable risk factors could put an end to this soaring burden.
Keywords: China; ambient particulate matter pollution; disability-adjusted life years; high body mass index; sociodemographic index; type 2 diabetes mellitus.
Copyright © 2024 Huang, He, Xu, Shen, Pan, Wu and Chen.
Conflict of interest statement
The authors declare that the research was conducted in the absence of any commercial or financial relationships that could be construed as a potential conflict of interest.
Figures
Similar articles
-
Global, regional, and national burden of type 2 diabetes mellitus caused by high BMI from 1990 to 2021, and forecasts to 2045: analysis from the global burden of disease study 2021.Front Public Health. 2025 Jan 23;13:1515797. doi: 10.3389/fpubh.2025.1515797. eCollection 2025. Front Public Health. 2025. PMID: 39916706 Free PMC article.
-
Type-2 Diabetes Mellitus (T2DM): Spatial-temporal Patterns of Incidence, Mortality and Attributable Risk Factors from 1990 to 2019 among 21 World Regions.Endocrine. 2022 Sep;77(3):444-454. doi: 10.1007/s12020-022-03125-5. Epub 2022 Jul 16. Endocrine. 2022. PMID: 35841511
-
National burden and risk factors of diabetes mellitus in China from 1990 to 2021: Results from the Global Burden of Disease study 2021.J Diabetes. 2024 Oct;16(10):e70012. doi: 10.1111/1753-0407.70012. J Diabetes. 2024. PMID: 39373380 Free PMC article.
-
Trends of the burden of type 2 diabetes mellitus attributable to high body mass index from 1990 to 2019 in China.Front Endocrinol (Lausanne). 2023 May 31;14:1193884. doi: 10.3389/fendo.2023.1193884. eCollection 2023. Front Endocrinol (Lausanne). 2023. PMID: 37324264 Free PMC article.
-
Burden of type 2 diabetes mellitus and its risk factors in North Africa and the Middle East, 1990-2019: findings from the Global Burden of Disease study 2019.BMC Public Health. 2024 Jan 5;24(1):98. doi: 10.1186/s12889-023-16540-8. BMC Public Health. 2024. PMID: 38183083 Free PMC article. Review.
Cited by
-
Causal association between air pollution and autoimmune diseases: a two-sample Mendelian randomization study.Front Public Health. 2024 Mar 28;12:1333811. doi: 10.3389/fpubh.2024.1333811. eCollection 2024. Front Public Health. 2024. PMID: 38605869 Free PMC article.
-
Global, regional, and national burden of type 2 diabetes mellitus caused by high BMI from 1990 to 2021, and forecasts to 2045: analysis from the global burden of disease study 2021.Front Public Health. 2025 Jan 23;13:1515797. doi: 10.3389/fpubh.2025.1515797. eCollection 2025. Front Public Health. 2025. PMID: 39916706 Free PMC article.
-
Role and mechanism of mitochondrial dysfunction‑related gene biomarkers in the progression of type 2 diabetes mellitus.Mol Med Rep. 2025 Jun;31(6):158. doi: 10.3892/mmr.2025.13523. Epub 2025 Apr 11. Mol Med Rep. 2025. PMID: 40211718 Free PMC article.
-
The relationship between sociodemographic characteristics, lifestyle, and diet quality with diabetes risk in overweight and obese Turkish adults.BMC Public Health. 2025 Jan 2;25(1):5. doi: 10.1186/s12889-024-21248-4. BMC Public Health. 2025. PMID: 39748361 Free PMC article.
-
Global burden of type 2 diabetes attributable to secondhand smoke: a comprehensive analysis from the GBD 2021 study.Front Endocrinol (Lausanne). 2025 Apr 29;16:1506749. doi: 10.3389/fendo.2025.1506749. eCollection 2025. Front Endocrinol (Lausanne). 2025. PMID: 40365229 Free PMC article.
References
-
- Federation, International Diabetes . IDF Diabetes Atlas, 10th Edition. (2021). Available at: https://doi.org/https://www.diabetesatlas.org/en/resources/.
-
- WHO . Global action plan for the prevention and control of noncommunicable diseases: 2013-2020. (2013). Available at: http://apps.who.int/iris/bitstream/10665/94384/1/9789241506236_eng.pdf (Accessed July 26, 2019).
-
- Dai H, Alsalhe TA, Chalghaf N, Ricco M, Bragazzi NL, Wu J. The global burden of disease attributable to high body mass index in 195 countries and territories, 1990-2017: An analysis of the Global Burden of Disease Study. PLoS Med. (2020) 17:e1003198. doi: 10.1371/journal.pmed.1003198, PMID: - DOI - PMC - PubMed
-
- GBD 2019 Diabetes and Air Pollution Collaborators . Estimates, trends, and drivers of the global burden of type 2 diabetes attributable to PM(2.5) air pollution, 1990-2019: an analysis of data from the Global Burden of Disease Study 2019. Lancet Planet Health. (2022) 6:e586–600. doi: 10.1016/S2542-5196(22)00122-X - DOI - PMC - PubMed
Publication types
MeSH terms
LinkOut - more resources
Full Text Sources
Medical