Neural correlates of thermal stimulation during active touch
- PMID: 38260029
- PMCID: PMC10800425
- DOI: 10.3389/fnins.2023.1320417
Neural correlates of thermal stimulation during active touch
Abstract
Introduction: Thermal feedback technologies have been explored in human-computer interaction to provide secondary information and enhance the overall user experience. Unlike fast-response haptic modalities such as vibration and force feedback, the human brain's processes associated with thermal feedback are not fully understood.
Methods: In this study, we utilize electroencephalography (EEG) brain imaging to systematically examine the neural correlates associated with a wide range of thermal stimuli, including 9, 15, 32, and 42°C, during active touch at the fingertip. A custom experimental setup is developed to provide thermal stimulation at the desirable temperature levels. A total of 30 participants are recruited to experience the four levels of thermal stimulation by actively touching a thermal stimulation unit with the index finger while recording brain activities via EEG. Time-frequency analysis and power spectral density (PSD) of the EEG data are utilized to analyze the delta, theta, alpha, beta, and gamma frequency bands.
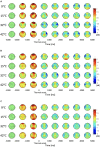
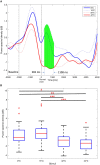
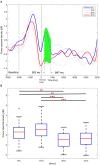
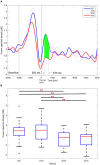
Results: The results show that the delta, theta, and alpha PSDs of 9 and 15°C stimuli are significantly higher than the PSDs of 32 and 42°C in the right frontal area during the early stage of the stimulation, from 282 ms up to 1,108 ms (One-way ANOVA test, Holm-Bonferroni correction, p < 0.05). No significant differences in PSDs are found between 9 and 15°C thermal stimuli or between 32 and 42°C thermal stimuli.
Discussion: The findings of this study inform the development of thermal feedback system in human-computer interaction.
Keywords: EEG response; active touch; human-computer interaction; power spectral density; thermal sensation.
Copyright © 2024 Park, Korres, Jamil and Eid.
Conflict of interest statement
The authors declare that the research was conducted in the absence of any commercial or financial relationships that could be construed as a potential conflict of interest.
Figures


Similar articles
-
EEG correlates to perceived urgency elicited by vibration stimulation of the upper body.Sci Rep. 2024 Jun 20;14(1):14267. doi: 10.1038/s41598-024-65289-6. Sci Rep. 2024. PMID: 38902337 Free PMC article.
-
Effects of stimulus mode and ambient temperature on cerebral responses to local thermal stimulation: An EEG study.Int J Psychophysiol. 2017 Mar;113:17-22. doi: 10.1016/j.ijpsycho.2017.01.003. Epub 2017 Jan 10. Int J Psychophysiol. 2017. PMID: 28082129
-
Mode and site of acupuncture modulation in the human brain: 3D (124-ch) EEG power spectrum mapping and source imaging.Neuroimage. 2006 Feb 15;29(4):1080-91. doi: 10.1016/j.neuroimage.2005.08.066. Epub 2005 Dec 1. Neuroimage. 2006. PMID: 16325429 Clinical Trial.
-
EEG guided electrical stimulation parameters generation from texture force profiles.J Neural Eng. 2022 Dec 20;19(6):10.1088/1741-2552/aca82e. doi: 10.1088/1741-2552/aca82e. J Neural Eng. 2022. PMID: 36537310 Free PMC article.
-
The neural correlates of psychosocial stress: A systematic review and meta-analysis of spectral analysis EEG studies.Neurobiol Stress. 2022 Apr 26;18:100452. doi: 10.1016/j.ynstr.2022.100452. eCollection 2022 May. Neurobiol Stress. 2022. PMID: 35573807 Free PMC article. Review.
Cited by
-
EEG correlates to perceived urgency elicited by vibration stimulation of the upper body.Sci Rep. 2024 Jun 20;14(1):14267. doi: 10.1038/s41598-024-65289-6. Sci Rep. 2024. PMID: 38902337 Free PMC article.
References
-
- Alsuradi H., Park W., Eid M. (2020a). Eeg-based neurohaptics research: a literature review. IEEE Access 8, 49313–49328. 10.1109/ACCESS.2020.2979855 - DOI
-
- Alsuradi H., Pawar C., Park W., Eid M. (2020b). “Detection of tactile feedback on touch-screen devices using eeg data,” in 2020 IEEE Haptics Symposium (HAPTICS) (IEEE: ), 775–780. 10.1109/HAPTICS45997.2020.ras.HAP20.16.8d90d0bd - DOI
-
- Breton A., Ronca V., Mallet-Dacosta A. I., Longatte F., Servajean-Hilst R., Attal Y. (2019). “Identifying the neural signature of thermic comfort sensation: neuroergonomic evaluation of a new ventilating system integrated in car seat,”İ in Conference Abstract: 2nd International Neuroergonomics Conference. 10.3389/conf.fnhum.2018.227.00008 - DOI
LinkOut - more resources
Full Text Sources

