. 2024 Jan 8:11:1322628.
doi: 10.3389/fchem.2023.1322628. eCollection 2023.

Decoding the secrets: how conformational and structural regulators inhibit the human 20S proteasome

Affiliations

Decoding the secrets: how conformational and structural regulators inhibit the human 20S proteasome

Pedro M P Fernandes et al. Front Chem. .

Abstract

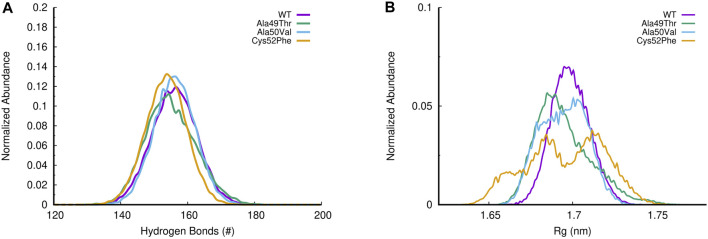
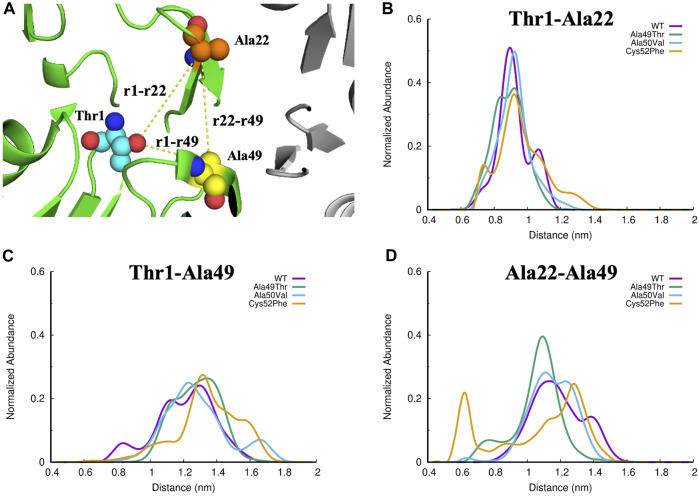
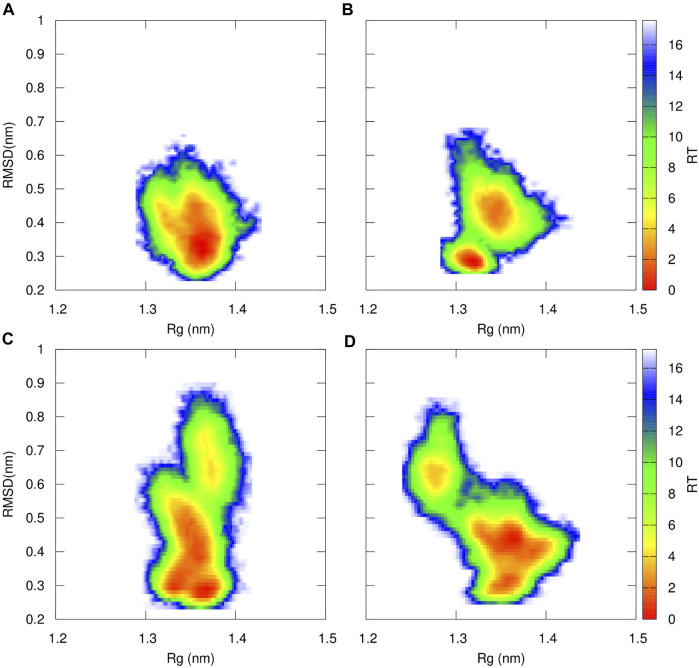
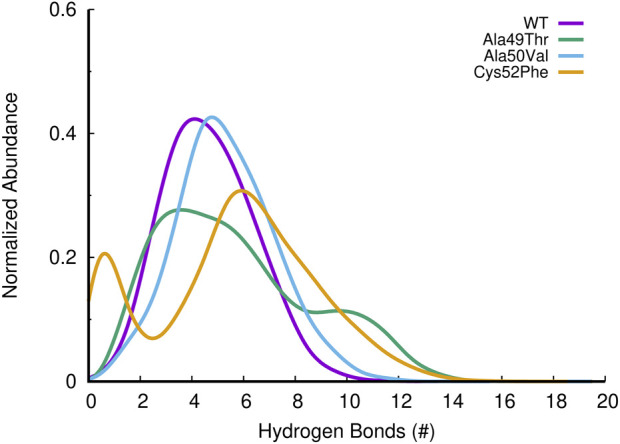
Acquired resistance to drugs that modulate specific protein functions, such as the human proteasome, presents a significant challenge in targeted therapies. This underscores the importance of devising new methodologies to predict drug binding and potential resistance due to specific protein mutations. In this work, we conducted an extensive computational analysis to ascertain the effects of selected mutations (Ala49Thr, Ala50Val, and Cys52Phe) within the active site of the human proteasome. Specifically, we sought to understand how these mutations might disrupt protein function either by altering protein stability or by impeding interactions with a clinical administered drug. Leveraging molecular dynamics simulations and molecular docking calculations, we assessed the effect of these mutations on protein stability and ligand affinity. Notably, our results indicate that the Cys52Phe mutation critically impacts protein-ligand binding, providing valuable insights into potential proteasome inhibitor resistance.

Keywords: 20S proteasome inhibitors; drug resistance; molecular docking; molecular dynamics; mutations.


Conflict of interest statement

The authors declare that the research was conducted in the absence of any commercial or financial relationships that could be construed as a potential conflict of interest. The author(s) declared that they were an editorial board member of Frontiers, at the time of submission. This had no impact on the peer review process and the final decision.

Figures

FIGURE 1
FIGURE 1
Structure of the 26S Proteasome. The 26S proteasome comprises the 20S core particle capped by the 19S regulatory particle. The 20S core particle comprises 28 subunits grouped in four rings stacked into a α-β-β-α pattern.
FIGURE 2
FIGURE 2
Molecular surface of the 20S proteasome β5 and β6 subunits and zoom of the CT-L catalytic site of the 20S proteasome (S1 region).
FIGURE 3
FIGURE 3
The proteasomal substrate binding channel with non-primed (S) and primed (S′) specificity pockets interacting with the amino acid side chains (P-sites) of a peptide. The reactive subunit, which contains the catalytic Thr1, is responsible for the primed substrate binding channel as well as the non-primed S1, S2, and S3 pockets.
FIGURE 4
FIGURE 4
Chemical structure of the four proteasome inhibitors currently on the market and/or approved. IC50 values of PIs on the CT-L active site: bortezomib (Demo et al., 2007), carfilzomib (Demo et al., 2007), ixazomib (Kupperman et al., 2010), and marizomib (Chauhan et al., 2005).
FIGURE 5
FIGURE 5
Representation of the β5 subunit, with emphasis on the catalytic pocket in orange. Part of the β5 subunit is represented by its secondary structure: β-sheet 1 (from residue 1–9), β-sheet 2 (from residue 10–18), β-sheet 3 (from residue 19–23), β-sheet 4 (from residue 24–29), β-sheet 5 (from residue 34–38), β-sheet 6 (from residue 39–47), α-helix 1 (from residue 49–70) and α-helix 2 (from residue 76–88). In sticks, we have also represented the N-terminal of the protein (Thr1), where typically 20S proteasome inhibitors covalently bind, Ala49, Ala50, and Cys52 (placed at the end of the β-sheet 3 and beginning of α-helix 1, respectively). This figure was built using PyMOL software (Schrödinger, 2023).
FIGURE 6
FIGURE 6
Zoom of the CT-L catalytic site of 20S proteasome. (A) Side chains of the three mutated residues and the N-terminal Thr1 are marked with sticks; (B), (C), and (D), X-ray binding pocket positions of bortezomib (BTZ), carfilzomib (CFZ) and ixazomib (IXA), respectively. All figures show the β5 and β6 subunits as cartoon, with β6 being faded out.
FIGURE 7
FIGURE 7
Histogram of the normalized abundance of the distribution of the RMSD of the c-alpha atoms of the β5 subunits for the WT, Ala49Thr, Ala50Val and Cys52Phe simulations. RMSD values were calculated taking as reference, the initial conformation of the system of the first replicate for each simulated system (only equilibrated regions of the simulations were considered).
FIGURE 8
FIGURE 8
Most representative conformations of the different simulated systems. In light green we have represented the crystallographic structure (PDB code: 5LE5) of the β5 subunit, while the β6 subunit is represented as a faded cartoon. (A) In dark green we have represented the most populated conformation found in the simulations of the WT system, with a RMSD of 0.4 nm in respect to the crystallographic structure; (B) In cyan we have represented the most populated conformation found in the simulations of the Ala49Thr mutant, with a RMSD of 0.5 nm; (C) In light pink we have represented the most populated conformation found in the simulations of the Ala50Val mutant, with a RMSD of 0.3 nm; (D) In grey we have represented the most populated conformation found in the simulations of the Cys52Phe mutant, with a RMSD of 0.4 nm. RMSD values were calculated taking as reference, the initial conformation of the system of the first replicate for each simulated system.
FIGURE 9
FIGURE 9
(A) Histogram of H-bonds distribution for all simulated systems; (B) Evaluation of the radius of gyration (R g ) in all β5 subunit simulations.
FIGURE 10
FIGURE 10
(A) Identification of the three regions of interest in the CT-L active site of the proteasome. The Thr1, Ala22 and Ala49 atoms are represented as small spheres, and the yellow lines represent the distances evaluated: (B) Thr1-Ala22, (C)Thr1-Ala49, and (D) Ala22-Ala49.
FIGURE 11
FIGURE 11
Free Energy Profiles for WT (A), Ala49Thr (B), Ala50Val (C) and Cys52Phe (D) of the catalytic region of the β5 subunit of the 20S proteasome that delimits the catalytic pocket (residues 1 to 60–Figure 5 for structural details) using RMSD and R g as structural coordinates. Both RMSD and R g were calculated using GROMACS software tools.
FIGURE 12
FIGURE 12
Histogram of the abundance of hydrogen bonds found between β5 and β6 subunits of the 20S proteasome, for the different simulated systems.
FIGURE 13
FIGURE 13
Superposition of the bortezomib docking poses of X-ray WT with docking results for: (A) bortezomib in docking validation, (B) WT, (C) Ala49Thr, (D) Ala50Val, and (E) Cys52Phe mutations with crystal structure 5LF3 (the crystallographic bortezomib is represented in green).
FIGURE 14
FIGURE 14
Ligand interactions established between bortezomib with the proteasome in the crystal structure 5LF3 and docking calculations performed using selected snapshots extracted from MD simulations of the WT and Ala49Thr, Ala50Val, and Cys52Phe mutants.
FIGURE 15
FIGURE 15
Superposition of the bortezomib docking poses of WT (A), Ala49Thr (B), Ala50Val (C), and Cys52Phe (D) mutations with crystal structure 5LF3 (the X-ray BTZ is represented in green). β5-β6 respective protein’s surfaces.

Similar articles

Cited by

References

    1. Abraham M. J., Murtola T., Schulz R., Páll S., Smith J. C., Hess B., et al. (2015). Gromacs: high performance molecular simulations through multi-level parallelism from laptops to supercomputers. SoftwareX 1 (2), 19–25. 10.1016/j.softx.2015.06.001 - DOI
    1. Adasme M. F., Linnemann K. L., Bolz S. N., Kaiser F., Salentin S., Haupt V. J., et al. (2021). PLIP 2021: expanding the scope of the protein–ligand interaction profiler to DNA and RNA. Nucleic Acids Res. 49, W530–W534. 10.1093/nar/gkab294 - DOI - PMC - PubMed
    1. Basse N., Montes M., Maréchal X., Qin L., Bouvier-Durand M., Genin E., et al. (2010). Novel organic proteasome inhibitors identified by virtual and in vitro screening. J. Med. Chem. 53, 509–513. 10.1021/jm9011092 - DOI - PubMed
    1. Beck P., Dubiella C., Groll M. (2012). Covalent and non-covalent reversible proteasome inhibition. bchm 393, 1101–1120. 10.1515/hsz-2012-0212 - DOI - PubMed
    1. Berendsen H. J. C., Postma J. P. M., van Gunsteren W. F., Hermans J. (1981). “Interaction models for water in relation to protein hydration,” in Intermolecular forces: proceedings of the fourteenth Jerusalem symposium on quantum Chemistry and biochemistry held in Jerusalem, Israel, april 13--16, 1981. Editor Pullman B. (Dordrecht: Springer Netherlands; ), 331–342. 10.1007/978-94-015-7658-1_21 - DOI

LinkOut - more resources