

Developing and demonstrating an atomistic and holistic model of anthropometric failure among children under five years of age using the National Family Health Survey (NFHS)-5 data from India
- PMID: 38260069
- PMCID: PMC10800737
- DOI: 10.3389/fnut.2023.1280219
Developing and demonstrating an atomistic and holistic model of anthropometric failure among children under five years of age using the National Family Health Survey (NFHS)-5 data from India
Abstract
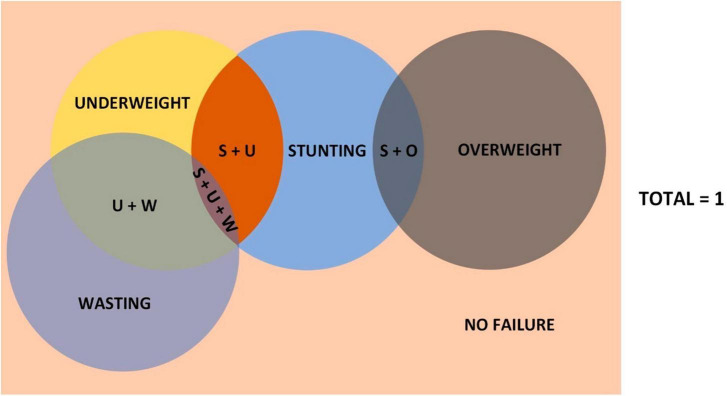
Introduction: Composite Index of Anthropometric Failure (CIAF) and its further modifications have not incorporated all the combinations of malnutrition. We propose a new model incorporating all the forms of malnutrition among children under five years of age. However, the current models might misclassify a growing child as malnourished. Our objective is to develop a comprehensive scoring system using the three anthropometric Z-scores [height-for-age (HAZ), weight-for-age (WAZ), and weight-for-height (WHZ) Z-scores] and demonstrate the proposed CIAF model using the National Family Health Survey-5 (NFHS-5) data from India.
Methods: A new scoring system was developed using the WAZ, HAZ, and WHZ scores to determine the child's nutritional status. We also proposed a new CIAF model by including all possible categories of malnutrition and practically demonstrated it using the NFHS-5 dataset after applying the new scoring system. Under-five children with heights, weights, and ages available were included in the analysis. The groups of malnutrition are presented as weighted proportions before and after applying the new score to the proposed model.
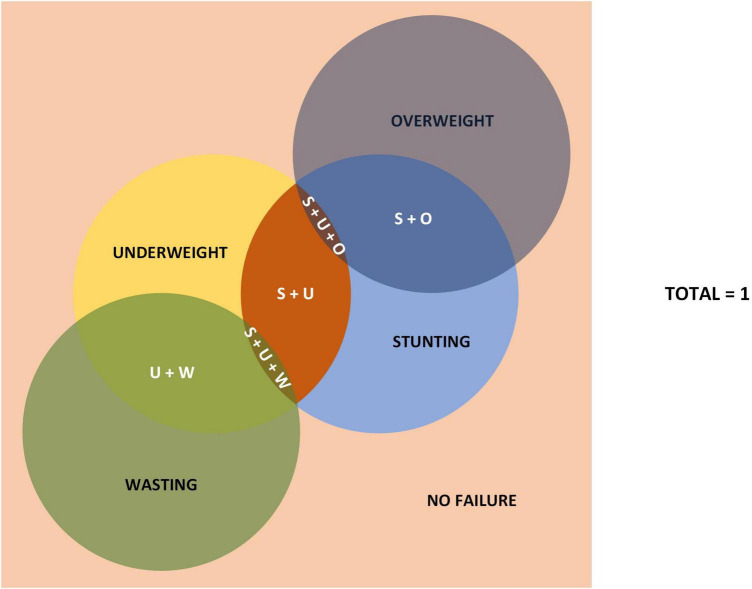
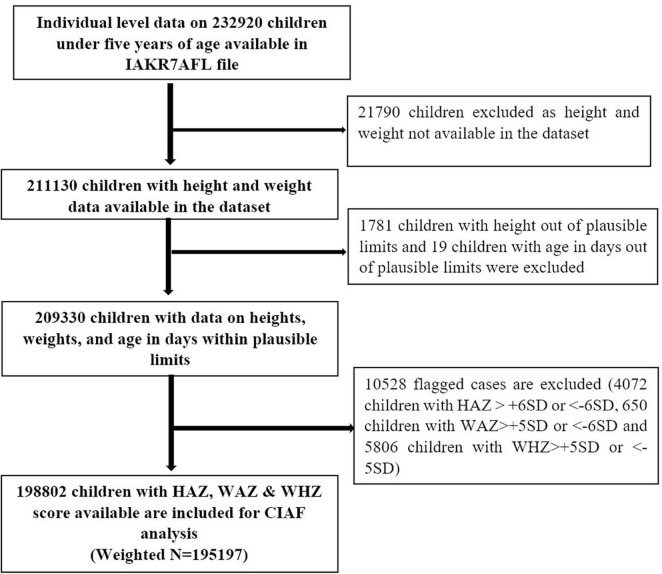
Results: Our final analysis included individual-level data of 198,802 children under five years of age (weighted N = 195,197). After applying the new scoring system to the proposed model, the prevalence of stunting has reduced to 11.8% (95% CI 11.66-11.94) from 13.2% (95% CI 13.09-13.39) and wasting prevalence has reduced to 4.9% (95% CI 4.85-5.04) from 6.4% (95% CI 6.29-6.51). The most common forms of anthropometric failures among Indian children by using the newly developed CIAF model are: "Stunting and underweight" (30,127; 15.4%), Stunting only (23,035; 11.8%), and "wasting and underweight" (14,698; 7.5%). We found a new category called "Stunting, underweight, and overweight" (stunting = HAZ < -2SD, underweight = WAZ < -2SD, overweight = WHZ > +2SD). It constituted 0.1% (220 children) of the total sample.
Conclusion: When the new scoring system is applied to the proposed CIAF model, it captures all forms and combinations of malnutrition among under-five children without overlap and prevents misclassifying a growing child as malnourished. The newly identified category shows that stunting (HAZ < -2SD), overweight (WHZ > +2SD) and underweight (WAZ < -2SD) can co-exist in the same child.
Keywords: National Family Health Survey-5; Z-score; anthropometric failure; malnutrition; under-five children; undernutrition.
Copyright © 2024 Nandeep, Jaleel, Reddy, Geddam, Reddy and Hemalatha.
Conflict of interest statement
The authors declare that the research was conducted in the absence of any commercial or financial relationships that could be construed as a potential conflict of interest.
Figures
Similar articles
-
Assessment of undernutrition using the composite index of anthropometric failure (CIAF) and its determinants: A cross-sectional study in the rural area of the Bogor District in Indonesia.BMC Nutr. 2022 Nov 16;8(1):133. doi: 10.1186/s40795-022-00627-3. BMC Nutr. 2022. PMID: 36384860 Free PMC article.
-
Magnitude of undernutrition in children aged 2 to 4 years using CIAF and conventional indices in the slums of Mumbai city.J Health Popul Nutr. 2015 Jul 10;33:3. doi: 10.1186/s41043-015-0017-x. J Health Popul Nutr. 2015. PMID: 26825557 Free PMC article.
-
Greater Reduction in Stunting Than Underweight and Wasting in Indian Under-Five Children: A Comparison of Growth Indicators from 4 National Family Health Surveys.Indian J Pediatr. 2023 Oct;90(10):982-987. doi: 10.1007/s12098-022-04143-x. Epub 2022 Jun 17. Indian J Pediatr. 2023. PMID: 35713770
-
Comparison of Nutritional Status of Healthy Under-Five Indian Children Using Composite Index of Anthropometric Failure on WHO 2006 versus 2019 Indian Synthetic Growth Charts.Indian J Pediatr. 2024 Jul;91(7):659-666. doi: 10.1007/s12098-023-04865-6. Epub 2023 Oct 26. Indian J Pediatr. 2024. PMID: 37880468
-
Alarming level of severe acute malnutrition in Indian districts.BMJ Glob Health. 2022 Apr;7(4):e007798. doi: 10.1136/bmjgh-2021-007798. BMJ Glob Health. 2022. PMID: 35450860 Free PMC article. Review.
Cited by
-
Co-Occurrences of Forms of Child Undernutrition in India: Insights from the National Family Health Survey.Nutrients. 2025 Mar 11;17(6):977. doi: 10.3390/nu17060977. Nutrients. 2025. PMID: 40290049 Free PMC article.
-
Nutritional Status of Children Under Five Years in the Slums of West Bengal, India: A Cross-Sectional Study on Prevalence, Characteristics, and Determinants.Nutrients. 2025 Feb 28;17(5):853. doi: 10.3390/nu17050853. Nutrients. 2025. PMID: 40077726 Free PMC article.
References
-
- Phadke M, Nair R, Menon P, Singal V. Evolution of anthropometry in malnutrition. Int J Nutr. (2020) 4:25–35. 10.14302/issn.2379-7835.ijn-19-3111 - DOI
-
- World Health Organization [WHO]. Physical Status: the Use of and Interpretation of Anthropometry, Report of a WHO Expert Committee. (2022). Available online at: https://www.who.int/publications-detail-redirect/9241208546 (accessed August 8, 2022). - PubMed
-
- Svedberg P. Poverty and Undernutrition: Theory, Measurement, and Policy. Oxford: Oxford University Press; (2000). 10.1093/0198292686.001.0001 - DOI
-
- Kuiti B, Bose K. The-concept-of-composite-index-of-anthropometric-failure-CIAF-revisited-and-revised. Anthropol Open J. (2018) 3:32–5.
LinkOut - more resources
Full Text Sources