. 2024 Jan 4:25:220-228.
doi: 10.1016/j.reth.2023.12.015. eCollection 2024 Mar.

Evaluation of adipogenesis over time using a novel bioabsorbable implant without the addition of exogenous cells or growth factors

Affiliations

Evaluation of adipogenesis over time using a novel bioabsorbable implant without the addition of exogenous cells or growth factors

Sunghee Lee et al. Regen Ther. .

Abstract

Background: Breast reconstruction is crucial for patients who have undergone mastectomy for breast cancer. Our bioabsorbable implants comprising an outer poly-l-lactic acid mesh and an inner component filled with collagen sponge promote and retain adipogenesis in vivo without the addition of exogenous cells or growth factors. In this study, we evaluated adipogenesis over time histologically and at the gene expression level using this implant in a rodent model.

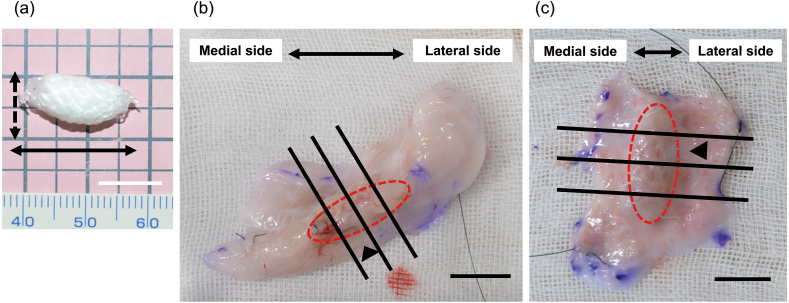
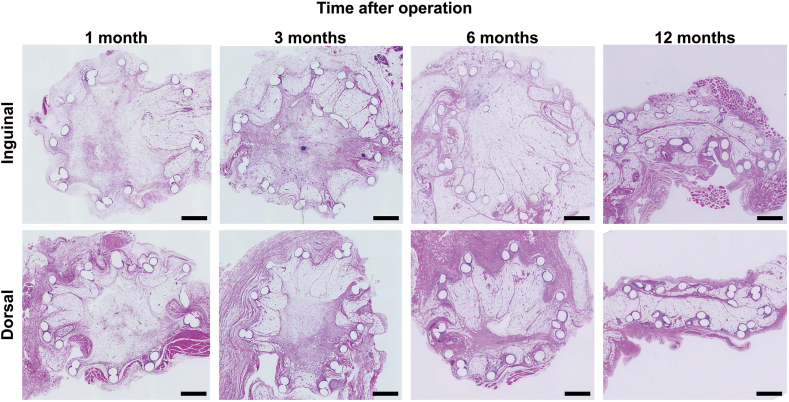
Methods: The implants were inserted in the inguinal and dorsal regions of the animals. At 1, 3, 6, and 12 months post-operation, the weight, volume, and histological assessment of all newly formed tissue were performed. We analyzed the formation of new adipose tissue using multiphoton microscopy and RNA sequencing.

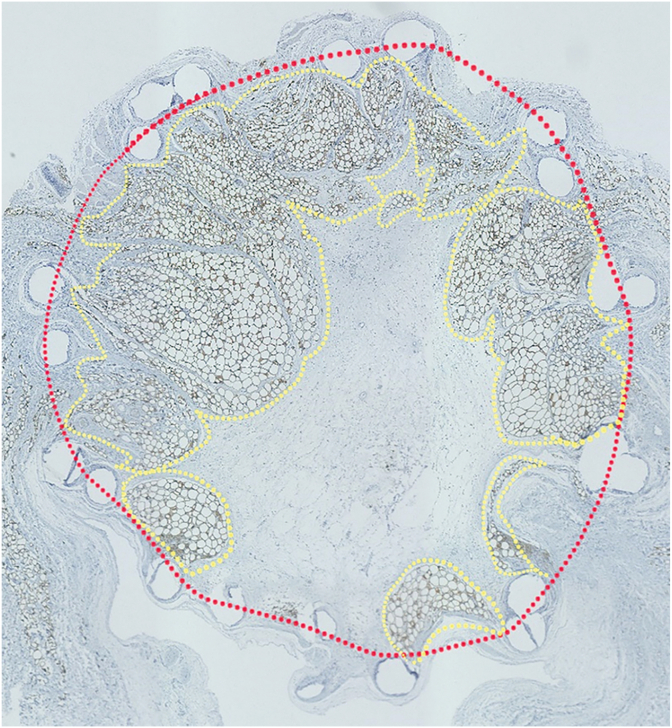
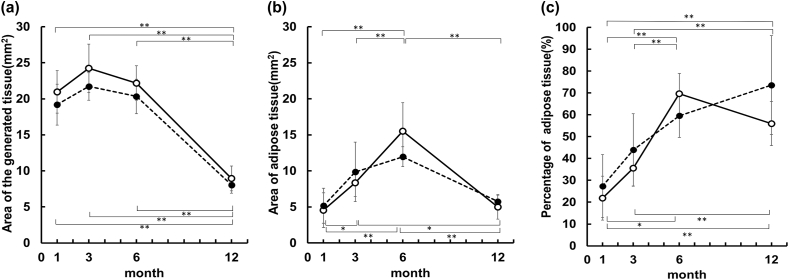
Results: Both in the inguinal and dorsal regions, adipose tissue began to form 1 month post-operation in the peripheral area. Angiogenesis into implants was observed until 3 months. At 6 months, microvessels matured and the amount of newly generated adipose tissue peaked and was uniformly distributed inside implants. The amount of newly generated adipose tissue decreased from 6 to 12 months but at 12 months, adipose tissue was equivalent to the native tissue histologically and in terms of gene expression.

Conclusions: Our bioabsorbable implants could induce normal adipogenesis into the implants after subcutaneous implantation. Our implants can serve as a novel and safe material for breast reconstruction without requiring exogenous cells or growth factors.

Keywords: Adipogenesis; Bioabsorbable; Breast cancer; Multiphoton excitation fluorescence microscopy.


Conflict of interest statement

The authors report no proprietary or commercial interest in any product mentioned or concept discussed in this article.

Figures

Fig. 1
Fig. 1
(a) Gross appearance of the implant. The implant consisted of a PLLA mesh with a CS. The dashed black arrow indicates the greatest diameter of the short axis of the implant, and the solid black arrow indicates the greatest length of the long axis of the implant. (b) Histological assessment of newly generated tissue in the inguinal model. (c) Histological assessment of newly generated tissue in the dorsal model. The area circled by the red dotted line represents the implant shape. The implant was divided into four equal parts along the long axis, as shown by the straight black line. The black arrowhead indicates the frozen specimen. Scale bar = 1 cm.
Fig. 2
Fig. 2
Evaluation of the area of newly generated tissue and adipose tissue inside the implants. The red dotted line shows the implant area, and the yellow dotted line shows the area of new adipose tissue inside the implants.
Fig. 3
Fig. 3
Weight and volume of all the newly formed tissues. (a) Gross appearance of all newly formed tissues. At the time of the operation, there was little adipose tissue in the dorsal region. As the rats grew, the subcutaneous area became entirely covered with adipose tissue. Upper row: inguinal model; lower row: dorsal model. Scale bar = 1 cm. (b) Time course of the weight and volume of all newly formed tissues in the inguinal model. In both the inguinal model and the dorsal model, the weight at 12 months was the heaviest and largest. Left graph: shows the time course of weight trend; right graph: the time course of the volume trend. Data are presented as the mean ± standard deviation. ∗p < 0.05, ∗∗p < 0.01. (c) Time course of the weight and volume of all newly formed tissues in the dorsal model. In both the inguinal model and the dorsal model, the volume at 12 months was the heaviest and largest. Left graph: the time course of weight; right graph: the time course of the volume. Data are presented as the mean ± standard deviation. ∗p < 0.05, ∗∗p < 0.01.
Fig. 4
Fig. 4
Light micrographs of H and E-stained sections of the newly regenerated tissue. In both the inguinal and dorsal models, the implant shape could be maintained for up to 6 months after the operation. Upper row: light micrographs in the inguinal model; lower row: light micrographs in the dorsal model. Scale bar = 1 cm.
Fig. 5
Fig. 5
Light micrographs of perilipin-stained sections of the newly generated tissue. In both the inguinal and dorsal models, the adipose tissue gradually increased from the edge of the implant after the operation. Upper row: light micrographs in the inguinal model. (a) 1 month, (b) 3 months, (c) 6 months, (d) 12 months after the operation. Lower row: light micrographs in the dorsal model. (e) 1 month, (f) 3 months, (g) 6 months, (h) 12 months after the operation. Scale bar = 1 cm.
Fig. 6
Fig. 6
Light micrographs of CD31-stained sections of the newly generated tissue. Many blood vessels were identified in adipose and non-adipose tissue areas inside the implant. Upper row: light micrographs in the inguinal model; lower row: light micrographs in the dorsal model. Scale bar = 1 cm.
Fig. 7
Fig. 7
Evaluation of the area of the newly generated and adipose tissues, as well as the percentage of adipose tissue inside the implants. (a) Area of the newly generated tissue inside the implant. In both inguinal and dorsal models, the area at 12 months after the operation was smaller than that at 1, 3, and 6 months. (b) Area of the newly generated adipose tissue inside the implant. In both the inguinal and dorsal models, the area peaked at 6 months for all observation points. (c) Percentage of adipose tissue in the newly generated tissue inside the implant. The percentage was maximum at 6 months in the inguinal model and increased till 12 months in the dorsal model. The upper p-values represent the inguinal model, and the lower p-values represent the dorsal model. Data are presented as the mean ± standard deviation. ∗p < 0.05, ∗∗p < 0.01. 〇 = inguinal model;, ● = dorsal model.
Fig. 8
Fig. 8
Multiphoton images of newly generated tissue 6 and 12 months after the operation were collected at 860 nm. At 12 months, the size of the adipocytes was uniform and almost the same as the native adipocytes. Upper row: inguinal model (a) 6 months, (b) 12 months after operation. Lower row: dorsal model. (c) 6 months, (d) 12 months after operation. In each set: 30x image. The specimens were stained with NileRed (adipocytes; yellow), Isolectin GS-IB4 from Griffonia simplicifolia, Alexa Fluor™ 488 Conjugate (blood vessels; red), and green shows SHG emission from collagen. Scale bars = 100 μm.
Fig. 9
Fig. 9
Multiphoton images of native adipose tissue and newly generated tissue cross-sections at 6 and 12 months after the operation were collected at 760 nm. At 12 months, blood vessels surrounded the adipocytes, running in the tufts of adipose tissue with branches. Upper row: inguinal model (a) 6 months, (b) 12 months after the operation. Lower row: dorsal model (c) 6 months, (d) 12 months after the operation. In each set: 30x image. The specimens were stained with NileRed (adipocytes; yellow), Isolectin GS-IB4 from Griffonia simplicifolia, Alexa Fluor™ 488 Conjugate (blood vessels; red), and Hoechst33342 (nuclei). Scale bars = 100 μm.
Fig. 10
Fig. 10
RNA sequencing. (a) Adipogenic differentiation (GO term: Fat cell differentiation, gene number: 123). The expression of factors related to adipogenic differentiation was similar to that of normal adipose tissue from 6 months to 12 months after the operation, with a relatively low expression pattern at 12 months compared to that at 6 months after the operation. (b) Regulation of angiogenesis (GO term: Regulation of angiogenesis, gene number: 226). For genes involved in angiogenesis, high expression was observed from 1 to 3 months after the operation, but thereafter, as with normal adipose tissue, no significant expression was observed until 12 months after the operation. (c) Cell death (GO term: Cell death, gene number: 746). The gene expression was no increase related to apoptosis or necrosis at 6 and 12 months after the operation.

Similar articles

Cited by

References

    1. Silverman B.G., Brown S.L., Bright R.A., Kaczmarek R.G., Arrowsmith-Lowe J.B., Kessler D.A. Reported complications of silicone gel breast implants: an epidemiologic review. Ann Intern Med. 1996;124:744–756. - PubMed
    1. Brown S.L., Silverman B.G., Berg W.A. Rupture of silicone-gel breast implants: causes, sequelae, and diagnosis. Lancet. 1997;350:1531–1537. - PubMed
    1. Kim B., Predmore Z.S., Mattke S., van Busum K., Gidengil C.A. Breast implant-associated anaplastic large cell lymphoma: updated results from a structured expert consultation process. Plast Reconstr Surg Glob Open. 2015;3:e296. - PMC - PubMed
    1. Alotaibi S., Hamadani M., Al-Mansour M., Aljurf M. Breast implant-associated anaplastic large cell lymphoma. Clin Lymphoma, Myeloma Leukemia. 2021;21:e272–e276. - PubMed
    1. Ellenbogen R. Free autogenous pearl fat grafts in the face--a preliminary report of a rediscovered technique. Ann Plast Surg. 1986;16:179–194. - PubMed

LinkOut - more resources