. 2024 Jan 8:14:1305168.
doi: 10.3389/fphys.2023.1305168. eCollection 2023.

Turkey hen sperm storage tubule transcriptome response to artificial insemination and the presence of semen

Affiliations

Turkey hen sperm storage tubule transcriptome response to artificial insemination and the presence of semen

Kristen Brady et al. Front Physiol. .

Abstract

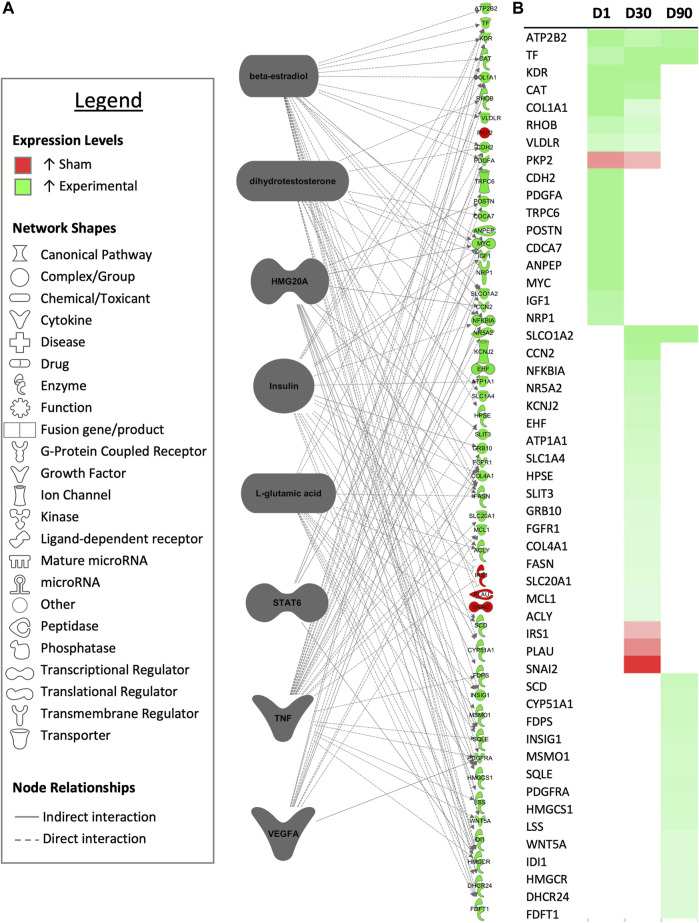
Introduction: Sperm storage within the uterovaginal junction (UVJ) of avian species occurs in specialized structures termed sperm storage tubules (SSTs) and allows for prolonged storage of semen, though the molecular mechanisms involved in semen preservation are not well understood. Little work has been done examining how function of the SSTs is impacted by insemination and by semen present in the SSTs. Methods: Transcriptome analysis was performed on isolated SSTs from turkey hens receiving no insemination (control), sham-insemination, or semen-insemination at three timepoints (D1, D30, and D90 post-insemination). Bioinformatic and functional annotation analyses were performed using CLC Genomics Workbench, Database for Annotation, Visualization, and Integrated Discovery (DAVID), and Ingenuity Pathway Analysis (IPA). Pairwise comparisons and k-medoids cluster analysis were utilized to decipher differential expression profiles in the treatment groups. Results: The SST transcriptome of the semen inseminated group exhibited the greatest differences within the group, with differences detectable for up to 90 days post insemination, while control and sham-inseminated groups were more similar. In the semen-inseminated samples, upregulation of pathways relating to classical and non-classical reproductive signaling, cytoskeletal remodeling, physiological parameters of the local UVJ environment, and cellular metabolism was observed. In the sham-inseminated samples, upregulation of immune pathways and non-reproductive endocrine hormones was observed. Discussion: This work provides insights into the molecular level changes of the SST in response to insemination as well as to the presence of semen. Results from this study may have direct implications on fertility rates as well as potential strategies for avian semen cryopreservation protocols.

Keywords: Turkey; artificial insemination; fertility; sperm storage tubule; transcriptome.


Conflict of interest statement

The authors declare that the research was conducted in the absence of any commercial or financial relationships that could be construed as a potential conflict of interest.

Figures

FIGURE 1
FIGURE 1
K-medoids cluster analysis of sperm storage tubules (SSTs) isolated from: control, sham-inseminated, and semen-inseminated at 1-day post-insemination (D1). The k-medoids cluster analysis tool from CLC Genomics (Qiagen, Valencia, CA) was used to identify genes exhibiting peak expression in treatment group. Genes included in the analysis were differentially expressed due to treatment (q < 0.05). Left panels show the expression profile and number of genes in each cluster (C = control, S = sham-insemination, E = semen-insemination). Right panels show enriched gene ontology (GO) term biological processes and molecular functions as well as KEGG pathway enrichment generated from Database for Annotation, Visualization, and Integrated Discovery (DAVID).
FIGURE 2
FIGURE 2
Network analysis of sperm storage tubules (SSTs) isolated at 1 day post insemination (D1). The core analysis tool from Ingenuity Pathway Analysis (IPA) (Qiagen, Valencia, CA) was used to biologically interpret differentially expressed genes (DEGs). Copyright permission from Qiagen has been obtained for use of the images presented. (A) The top network generated through pathway analysis of DEGs between control and sham-inseminated hens (FPKM > 1, q-value < 0.05, |fold change| > 1.5). (B) The top network generated through pathway analysis of DEGs between sham-inseminated and semen-inseminated hens (FPKM > 1, q-value < 0.05, |fold change| > 1.5).
FIGURE 3
FIGURE 3
K-medoids cluster analysis of sperm storage tubules (SSTs) isolated from: control, sham-inseminated, and semen-inseminated at 30-days post-insemination (D30). The k-medoids cluster analysis tool from CLC Genomics (Qiagen, Valencia, CA) was used to identify genes exhibiting peak expression in treatment group. Genes included in the analysis were differentially expressed due to treatment (q < 0.05). Left panels show the expression profile and number of genes in each cluster (C = control, S = sham-insemination, E = semen-insemination). Right panels show enriched gene ontology (GO) term biological processes and molecular functions as well as KEGG pathway enrichment generated from Database for Annotation, Visualization, and Integrated Discovery (DAVID).
FIGURE 4
FIGURE 4
Network analysis of sperm storage tubules (SSTs) isolated at 30-days post insemination (D30). The core analysis tool from Ingenuity Pathway Analysis (IPA) (Qiagen, Valencia, CA) was used to biologically interpret differentially expressed genes (DEGs). Copyright permission from Qiagen has been obtained for use of the images presented. (A) The top network generated through pathway analysis of DEGs between control and sham-inseminated hens (FPKM > 1, q-value < 0.05, |fold change| > 1.5). (B) The top network generated through pathway analysis of DEGs between sham-inseminated and semen-inseminated hens (FPKM > 1, q-value < 0.05, |fold change| > 1.5).
FIGURE 5
FIGURE 5
K-medoids cluster analysis of sperm storage tubules (SSTs) isolated from: control, sham-inseminated, and semen-inseminated at 90-days post-insemination (D90). The k-medoids cluster analysis tool from CLC Genomics (Qiagen, Valencia, CA) was used to identify genes exhibiting peak expression in treatment group. Genes included in the analysis were differentially expressed due to treatment (q < 0.05). Left panels show the expression profile and number of genes in each cluster (C = control, S = sham-insemination, E = semen-insemination). Right panels show enriched gene ontology (GO) term biological processes and molecular functions as well as KEGG pathway enrichment generated from Database for Annotation, Visualization, and Integrated Discovery (DAVID).
FIGURE 6
FIGURE 6
Network analysis of sperm storage tubules (SSTs) isolated at 90-days post insemination (D90). The core analysis tool from Ingenuity Pathway Analysis (IPA) (Qiagen, Valencia, CA) was used to biologically interpret differentially expressed genes (DEGs). Copyright permission from Qiagen has been obtained for use of the images presented. (A) The top network generated through pathway analysis of DEGs between control and sham-inseminated hens (FPKM > 1, q-value < 0.05, |fold change| > 1.5). (B) The top network generated through pathway analysis of DEGs between sham-inseminated and semen-inseminated hens (FPKM > 1, q-value < 0.05, |fold change| > 1.5).
FIGURE 7
FIGURE 7
Common upstream regulators occurring multiple timepoints. (A) Common predicted upstream regulators for each experimental timepoint from the core analysis tool of Ingenuity Pathway Analysis (Qiagen, Valencia, CA) are presented. Only upstream regulators with significant predicted activity (|z-score| > 2, p < 0.05) are represented. Downstream targets exhibiting differential expression between sham-inseminated and semen-inseminated samples are presented (FPKM > 1, q-value < 0.05, |fold change| > 1.5). (B) Heat map expression profiles for each target gene 1-day (D1), 30-days (D30), and 90-days (D90) post-insemination. Green represents increased expression in semen-inseminated samples, while red represents higher expression in sham-inseminated samples.

Similar articles

Cited by

References

    1. Andrews S. (2010). FastQC: a quality control tool for high throughput sequence data. Available online at: http://www.bioinformatics.babraham.ac.uk/projects/fastqc/.
    1. Ashizawa K., Hashiguchi A., Tsuzuki Y. (1992). Intracellular free Ca2+ concentration in fowl spermatozoa and its relationship to motility and respiration in spermatozoa. Reproduction 96 (1), 395–405. 10.1530/jrf.0.0960395 - DOI - PubMed
    1. Atikuzzaman M., Bhai R. M., Fogelholm J., Wright D., Rodriguez-Martinez H. (2015). Mating induces the expression of immune-and pH-regulatory genes in the utero-vaginal junction containing mucosal sperm-storage tubuli of hens. Reproduction 150 (6), 473–483. 10.1530/REP-15-0253 - DOI - PMC - PubMed
    1. Bakst M. R. (1987). Anatomical basis of sperm-storage in the avian oviduct. Scanning Microsc. 1, 1257–1266. - PubMed
    1. Bakst M. R. (1992). Observations on the Turkey oviductal sperm-storage tubule using differential interference contrast microscopy. J. Reproduction Fertil. 95, 877–883. 10.1530/jrf.0.0950877 - DOI - PubMed

LinkOut - more resources